EE.UU./GLOBAL: +1-949-461-9292
EUROPA: +39-011-3052-794
CONTACTO

Category: Liquid Tribology


Rendimiento de la abrasión del papel de lija con un tribómetro

RENDIMIENTO DE ABRASIÓN DEL PAPEL DE LIJA

UTILIZANDO UN TRIBÓMETRO

Preparado por

DUANJIE LI, Doctor

INTRODUCCIÓN

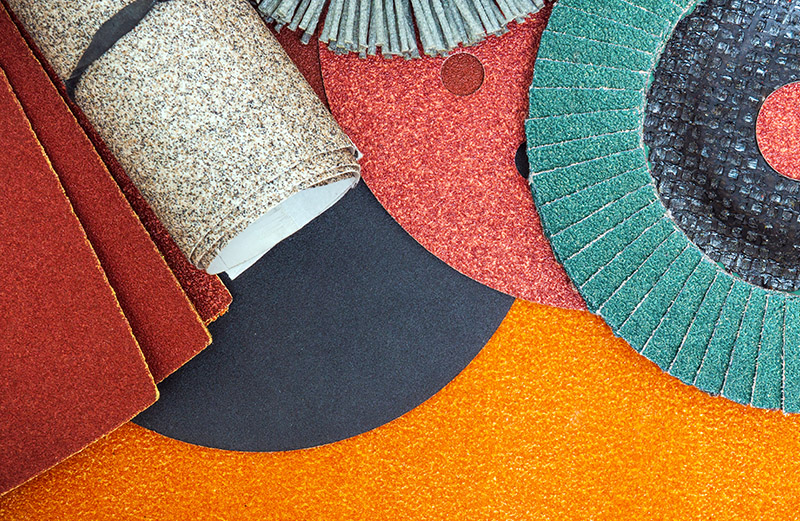
El papel de lija consiste en partículas abrasivas pegadas a una cara de un papel o tela. Pueden utilizarse diversos materiales abrasivos para las partículas, como granate, carburo de silicio, óxido de aluminio y diamante. Las lijas se aplican ampliamente en diversos sectores industriales para crear acabados superficiales específicos en madera, metal y paneles de yeso. Suelen trabajar en contacto con alta presión aplicada a mano o con herramientas eléctricas.

IMPORTANCIA DE EVALUAR EL RENDIMIENTO A LA ABRASIÓN DEL PAPEL DE LIJA

La eficacia del papel de lija suele venir determinada por su rendimiento de abrasión en distintas condiciones. El tamaño de grano, es decir, el tamaño de las partículas abrasivas incrustadas en la lija, determina la velocidad de desgaste y el tamaño de rayado del material lijado. Las lijas con un número de grano más alto tienen partículas más pequeñas, lo que se traduce en velocidades de lijado más bajas y acabados superficiales más finos. Las lijas con el mismo número de grano pero fabricadas con materiales diferentes pueden tener comportamientos distintos en condiciones secas o húmedas. Se necesitan evaluaciones tribológicas fiables para garantizar que el papel de lija fabricado posee el comportamiento abrasivo deseado. Estas evaluaciones permiten a los usuarios comparar cuantitativamente los comportamientos de desgaste de diferentes tipos de lijas de forma controlada y monitorizada con el fin de seleccionar el mejor candidato para la aplicación deseada.
OBJETIVO DE MEDICIÓN

En este estudio, mostramos la capacidad del Tribómetro NANOVEA para evaluar cuantitativamente el rendimiento de abrasión de varias muestras de papel de lija en condiciones secas y húmedas.

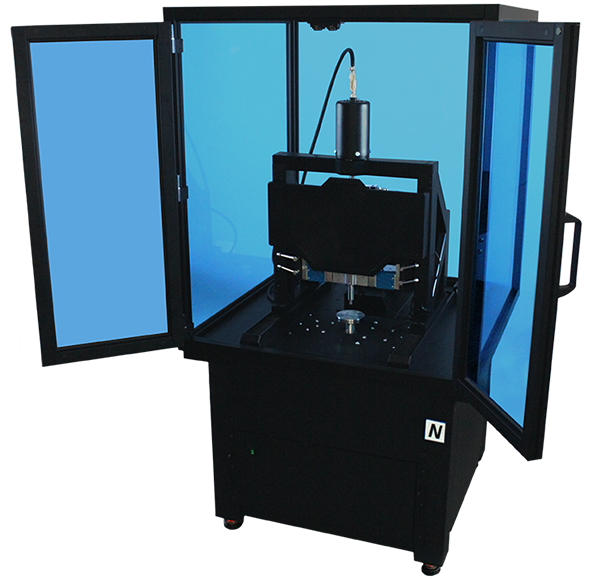
NANOVEA

T2000

PROCEDIMIENTOS DE PRUEBA

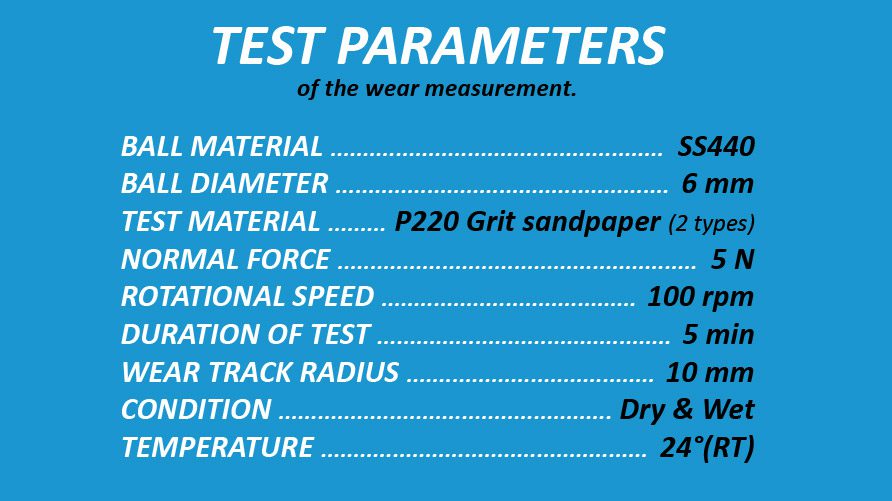
El coeficiente de fricción (COF) y el rendimiento de abrasión de dos tipos de lijas se evaluaron con el tribómetro NANOVEA T100. Se utilizó una bola de acero inoxidable 440 como contramaterial. Las cicatrices de desgaste de la bola se examinaron después de cada prueba de desgaste utilizando el NANOVEA Perfilador óptico 3D sin contacto para garantizar mediciones precisas de la pérdida de volumen.

Tenga en cuenta que se eligió una bola de acero inoxidable 440 como contramaterial para crear un estudio comparativo, pero se podría sustituir por cualquier material sólido para simular una condición de aplicación diferente.

RESULTADOS DE LAS PRUEBAS Y DEBATE

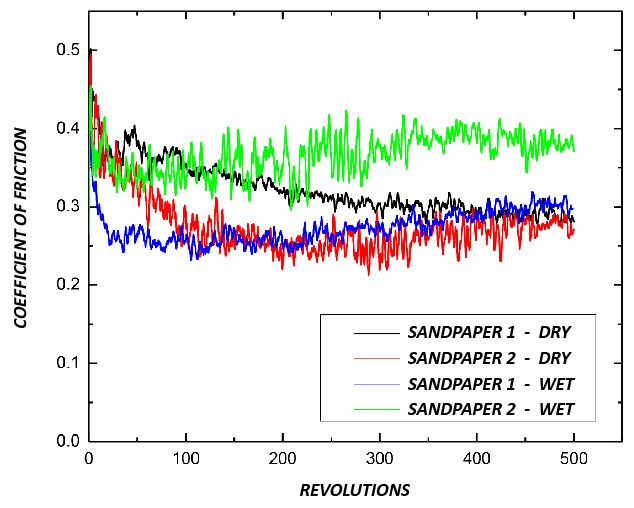
La FIGURA 1 muestra una comparación del COF de los papeles de lija 1 y 2 en condiciones ambientales secas y húmedas. El papel de lija 1, en condiciones secas, muestra un COF de 0,4 al principio de la prueba, que disminuye progresivamente y se estabiliza en 0,3. En condiciones húmedas, esta muestra muestra un COF medio inferior, de 0,27. En condiciones húmedas, esta muestra presenta un COF medio inferior de 0,27. Por el contrario, los resultados del COF de la muestra 2 muestran un COF en seco de 0,27 y en húmedo de ~ 0,37. 

Obsérvese que la oscilación en los datos de todos los gráficos COF fue causada por las vibraciones generadas por el movimiento de deslizamiento de la bola contra las superficies rugosas del papel de lija.
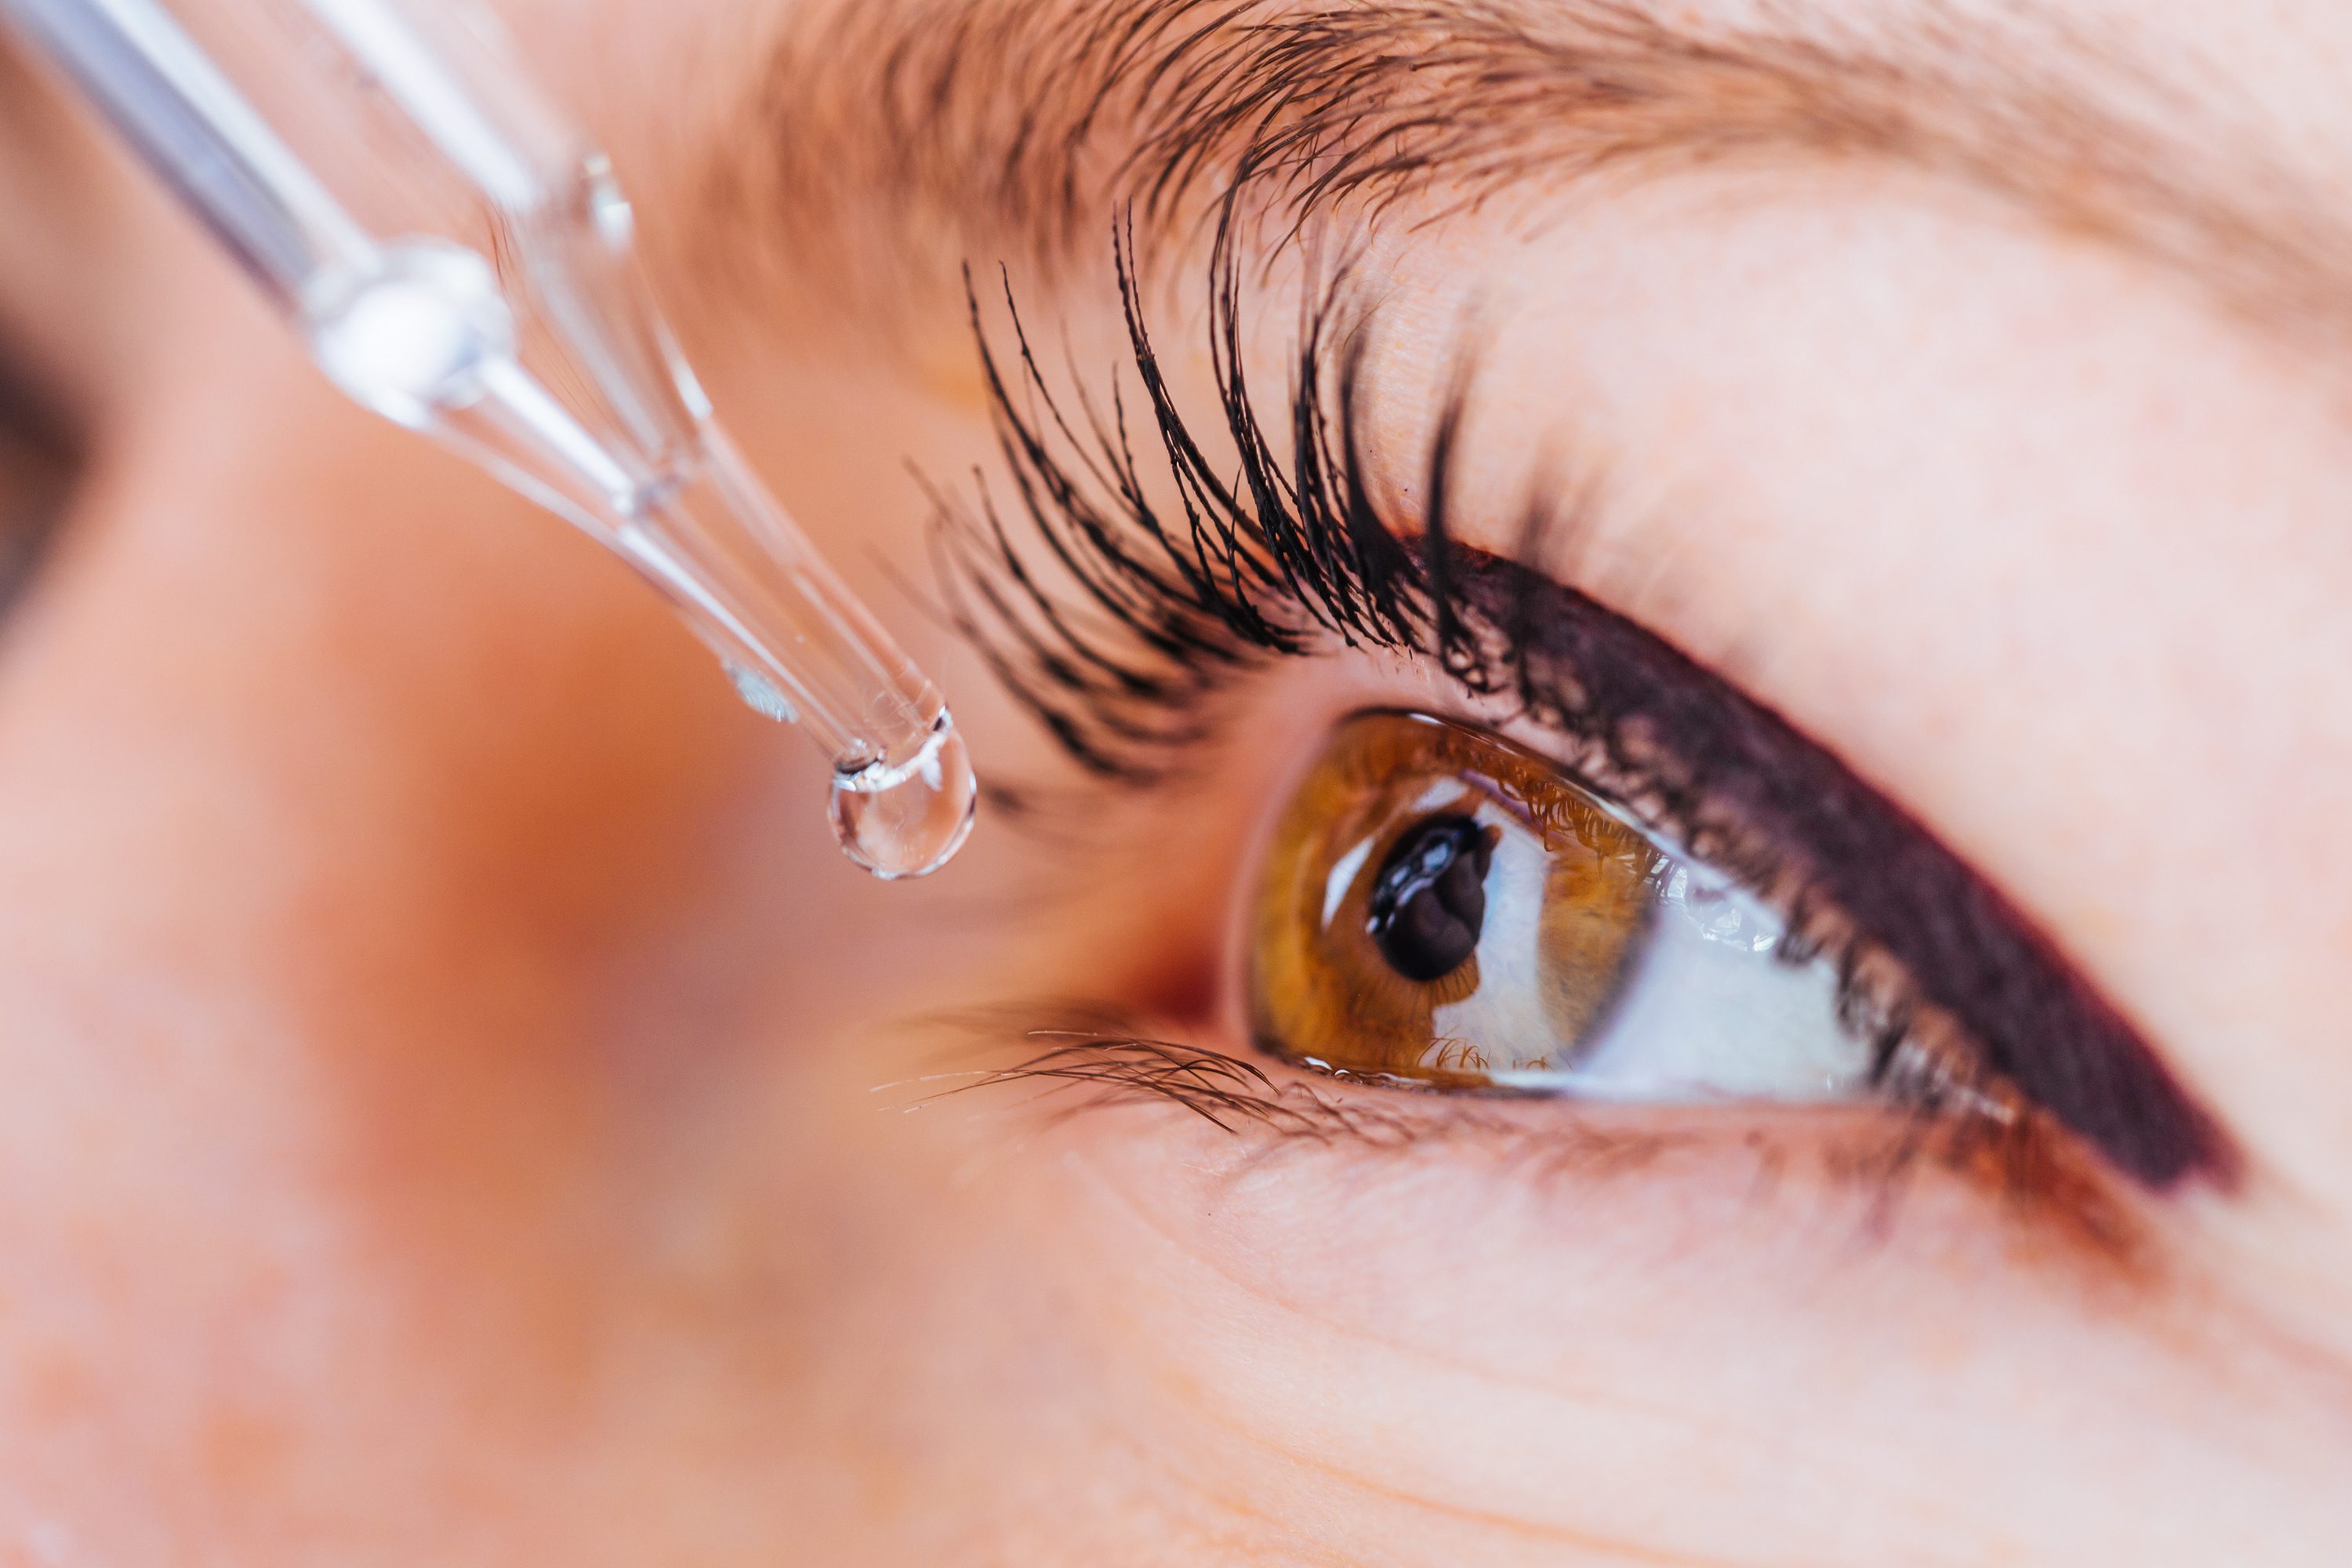
FIGURA 1: Evolución del COF durante las pruebas de desgaste.
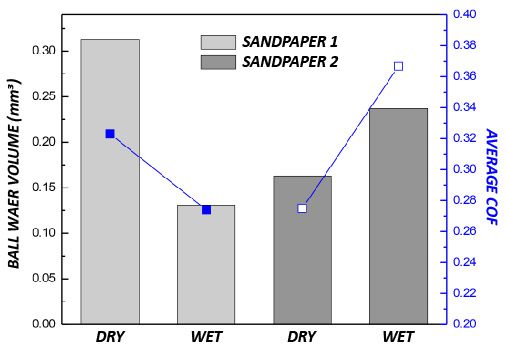
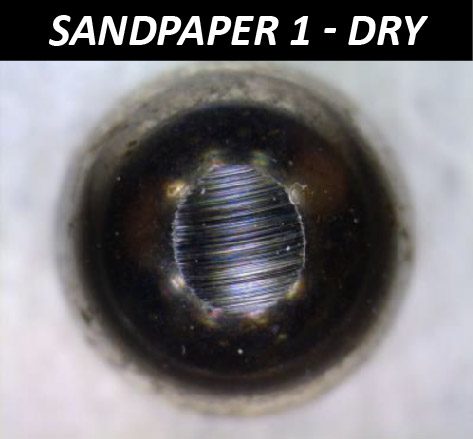
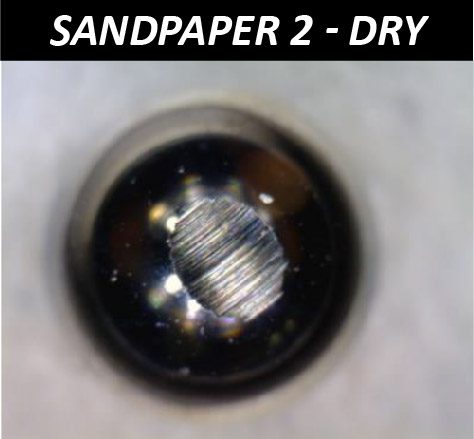
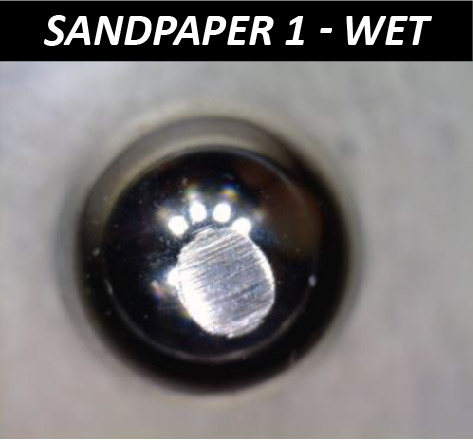
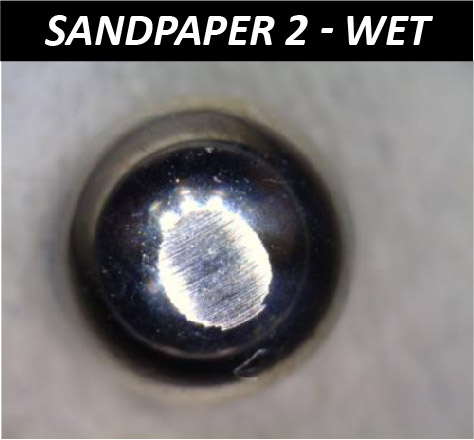
La FIGURA 2 resume los resultados del análisis de las cicatrices de desgaste. Las cicatrices de desgaste se midieron utilizando un microscopio óptico y un perfilador óptico sin contacto NANOVEA 3D. La FIGURA 3 y la FIGURA 4 comparan las cicatrices de desgaste de las bolas SS440 desgastadas después de las pruebas de desgaste en el papel de lija 1 y 2 (condiciones húmedas y secas). Como se muestra en la FIGURA 4, el Perfilador Óptico NANOVEA captura con precisión la topografía de la superficie de las cuatro bolas y sus respectivas huellas de desgaste que luego fueron procesadas con el software de Análisis Avanzado NANOVEA Mountains para calcular la pérdida de volumen y la tasa de desgaste. En la imagen microscópica y de perfil de la bola se puede observar que la bola utilizada para la prueba de lija 1 (seca) exhibió una cicatriz de desgaste aplanada más grande en comparación con las otras, con una pérdida de volumen de 0,313 mm3. En cambio, la pérdida de volumen del papel de lija 1 (húmedo) fue de 0,131 mm3. Para el papel de lija 2 (seco) la pérdida de volumen fue de 0,163 mm3 y para la lija 2 (húmeda) la pérdida de volumen aumentó a 0,237 mm3.

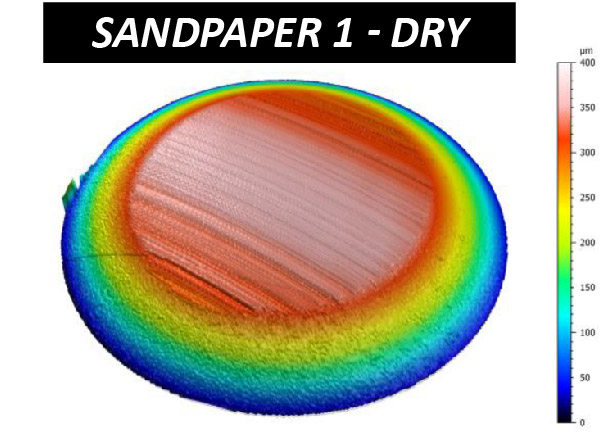
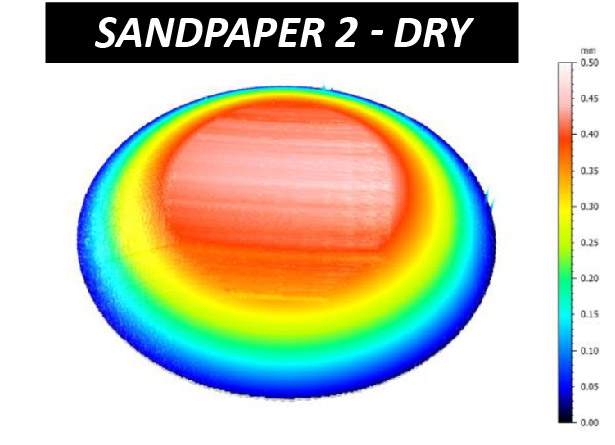
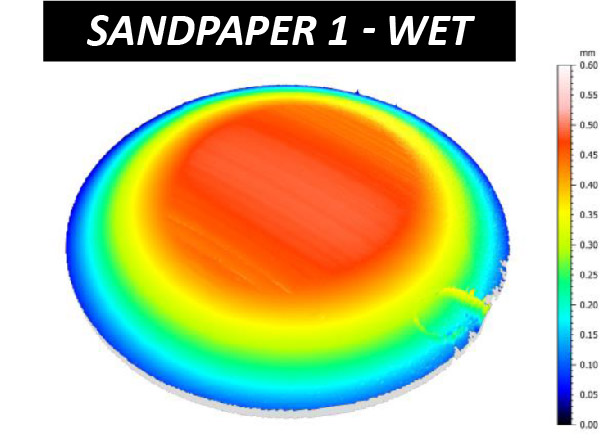
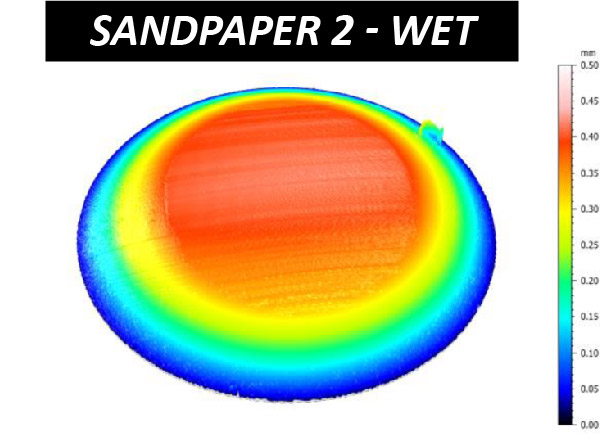
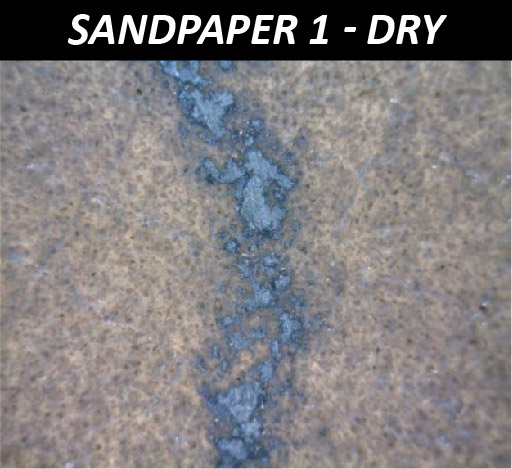
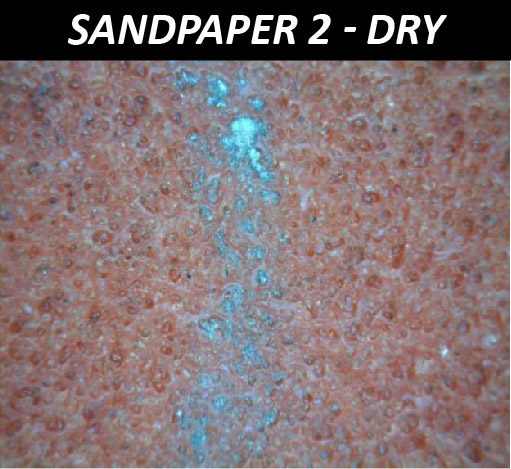
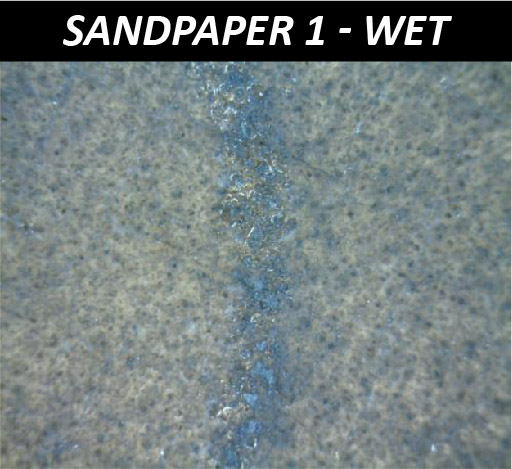
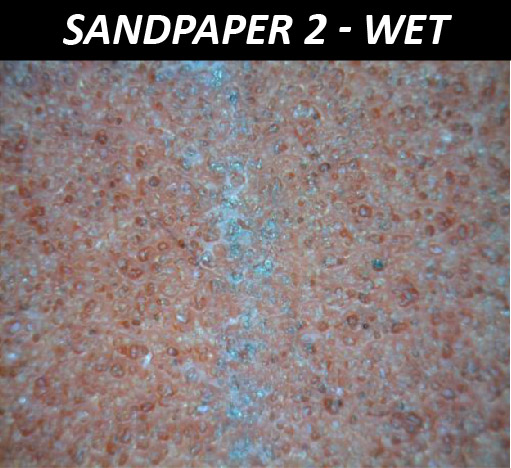
Además, es interesante observar que el COF desempeñó un papel importante en el rendimiento de abrasión de las lijas. La lija 1 presentaba un COF más elevado en seco, lo que se tradujo en un mayor índice de abrasión de la bola SS440 utilizada en la prueba. En comparación, el mayor COF de la lija 2 en húmedo dio lugar a un mayor índice de abrasión. Las huellas de desgaste de las lijas tras las mediciones se muestran en la FIGURA 5.

Ambas lijas, 1 y 2, afirman funcionar tanto en seco como en húmedo. Sin embargo, mostraron un rendimiento de abrasión significativamente diferente en seco y en húmedo. NANOVEA tribómetros proporcionan capacidades de evaluación del desgaste cuantificables y fiables, bien controladas, que garantizan evaluaciones del desgaste reproducibles. Además, la capacidad de medición in situ del COF permite a los usuarios correlacionar las diferentes etapas de un proceso de desgaste con la evolución del COF, lo que resulta crítico para mejorar la comprensión fundamental del mecanismo de desgaste y las características tribológicas del papel de lija

FIGURA 2: Volumen de la cicatriz de desgaste de las bolas y COF medio en diferentes condiciones.

FIGURA 3: Cicatrices de desgaste de las bolas después de las pruebas.

FIGURA 4: Morfología 3D de las cicatrices de desgaste en las bolas.

FIGURA 5: Huellas de desgaste en las lijas en diferentes condiciones.

CONCLUSIÓN

En este estudio se evaluó el rendimiento de abrasión de dos tipos de lijas del mismo número de grano en condiciones secas y húmedas. Las condiciones de servicio de la lija desempeñan un papel fundamental en la eficacia del rendimiento de trabajo. La lija 1 tuvo un comportamiento de abrasión significativamente mejor en condiciones secas, mientras que la lija 2 obtuvo mejores resultados en condiciones húmedas. La fricción durante el proceso de lijado es un factor importante a considerar cuando se evalúa el rendimiento de abrasión. El Perfilador Óptico NANOVEA mide con precisión la morfología 3D de cualquier superficie, como las cicatrices de desgaste en una bola, garantizando una evaluación fiable sobre el rendimiento de abrasión del papel de lija en este estudio. El Tribómetro NANOVEA mide el coeficiente de fricción in situ durante una prueba de desgaste, proporcionando una visión de las diferentes etapas de un proceso de desgaste. También ofrece pruebas repetibles de desgaste y fricción utilizando modos rotativos y lineales conformes a las normas ISO y ASTM, con módulos opcionales de desgaste y lubricación a alta temperatura disponibles en un sistema preintegrado. Esta gama inigualable permite a los usuarios simular diferentes entornos de trabajo severos de los rodamientos de bolas, incluyendo alta tensión, desgaste y alta temperatura, etc. También proporciona una herramienta ideal para evaluar cuantitativamente los comportamientos tribológicos de materiales superiores resistentes al desgaste bajo cargas elevadas.

AHORA, HABLEMOS DE SU SOLICITUD

Pruebas de desgaste del pistón

Pruebas de desgaste del pistón

Using a Tribometer

Preparado por

FRANK LIU

INTRODUCCIÓN

Friction loss accounts for approximately 10% of total energy in fuel for a diesel engine[1]. 40-55% of the friction loss comes from the power cylinder system. The loss of energy from friction can be diminished with better understanding of the tribological interactions occurring in the power cylinder system.

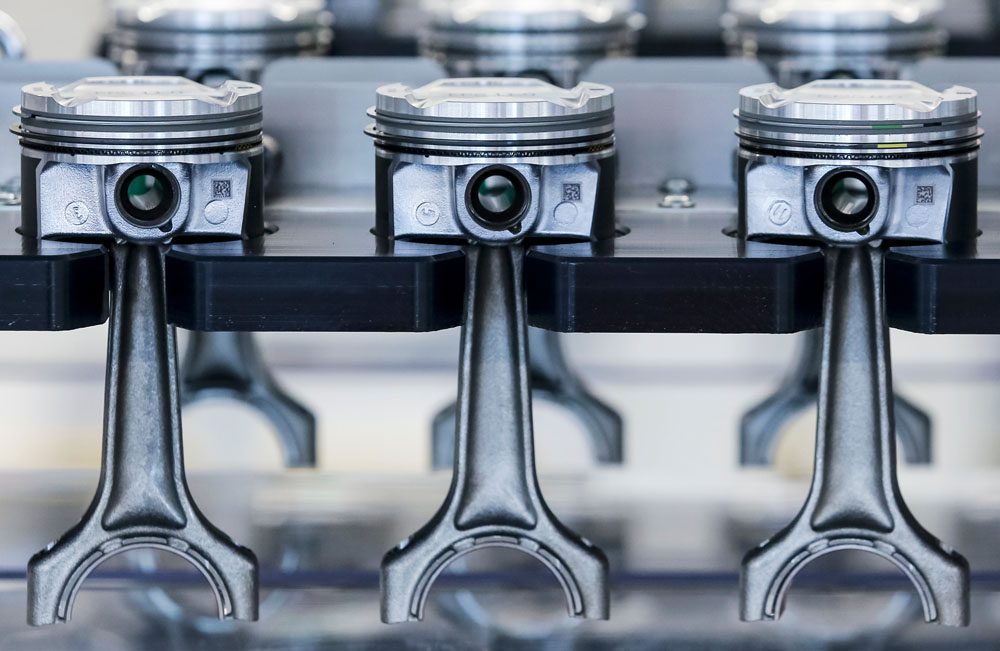
A significant portion of the friction loss in the power cylinder system stems from the contact between the piston skirt and the cylinder liner. The interaction between the piston skirt, lubricant, and cylinder interfaces is quite complex due to the constant changes in force, temperature, and speed in a real life engine. Optimizing each factor is key to obtaining optimal engine performance. This study will focus on replicating the mechanisms causing friction forces and wear at the piston skirt-lubricant-cylinder liner (P-L-C) interfaces.

 Schematic of power cylinders system and piston skirt-lubricant-cylinder liner interfaces.

[1] Bai, Dongfang. Modeling piston skirt lubrication in internal combustion engines. Diss. MIT, 2012

IMPORTANCE OF TESTING PISTONS WITH TRIBOMETERS

Motor oil is a lubricant that is well-designed for its application. In addition to the base oil, additives such as detergents, dispersants, viscosity improver (VI), anti-wear/anti-friction agents, and corrosion inhibitors are added to improve its performance. These additives affect how the oil behaves under different operating conditions. The behavior of oil affects the P-L-C interfaces and determines if significant wear from metal-metal contact or if hydrodynamic lubrication (very little wear) is occurring.

It is difficult to understand the P-L-C interfaces without isolating the area from external variables. It is more practical to simulate the event with conditions that are representative of its real-life application. The NANOVEA Tribómetro is ideal for this. Equipped with multiple force sensors, depth sensor, a drop-by-drop lubricant module, and linear reciprocating stage, the NANOVEA T2000 is able to closely mimic events occurring within an engine block and obtain valuable data to better understand the P-L-C interfaces.

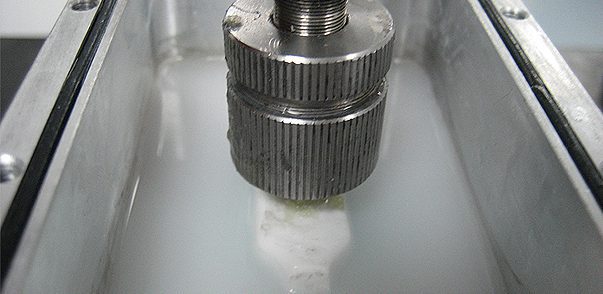
Liquid Module on the NANOVEA T2000 Tribometer

The drop-by-drop module is crucial for this study. Since pistons can move at a very fast rate (above 3000 rpm), it is difficult to create a thin film of lubricant by submerging the sample. To remedy this issue, the drop-by-drop module is able to consistently apply a constant amount of lubricant onto the piston skirt surface.

Application of fresh lubricant also removes concern of dislodged wear contaminants influencing the lubricant’s properties.

NANOVEA T2000

High Load Tribometer

OBJETIVO DE MEDICIÓN

The piston skirt-lubricant-cylinder liner interfaces will be studied in this report. The interfaces will be replicated by conducting a linear reciprocating wear test with drop-by-drop lubricant module.

The lubricant will be applied at room temperature and heated conditions to compare cold start and optimal operation conditions. The COF and wear rate will be observed to better understand how the interfaces behaves in real-life applications.

PARÁMETROS DE PRUEBA

for tribology testing on pistons

CARGAR ………………………. 100 N

DURACIÓN DE LA PRUEBA ………………………. 30 min

VELOCIDAD ………………………. 2000 rpm

AMPLITUD ………………………. 10 mm

TOTAL DISTANCE ………………………. 1200 m

SKIRT COATING ………………………. Moly-graphite

PIN MATERIAL ………………………. Aluminum Alloy 5052

PIN DIAMETER ………………………. 10 mm

LUBRICANTE ………………………. Motor Oil (10W-30)

APPROX. FLOW RATE ………………………. 60 mL/min

TEMPERATURA ………………………. Room temp & 90°C

LINEAR RECIPROCATING TEST RESULTS

In this experiment, A5052 was used as the counter material. While engine blocks are usually made of cast aluminum such as A356, A5052 have mechanical properties similar to A356 for this simulative testing [2].

Under the testing conditions, significant wear was
observed on the piston skirt at room temperature
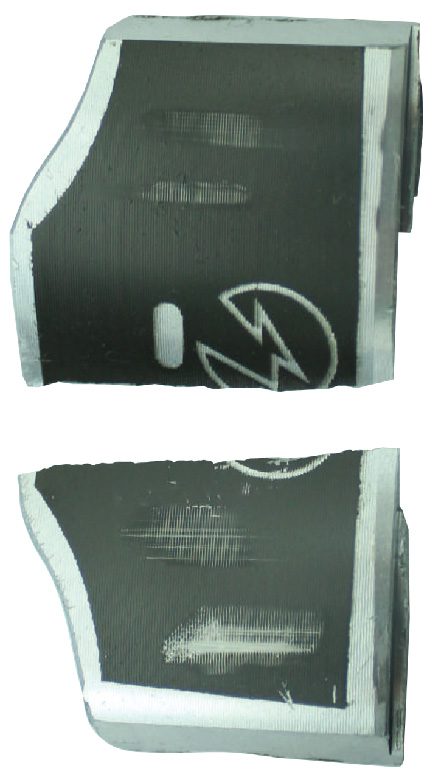
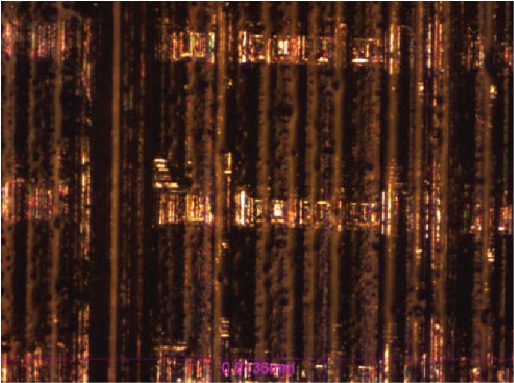
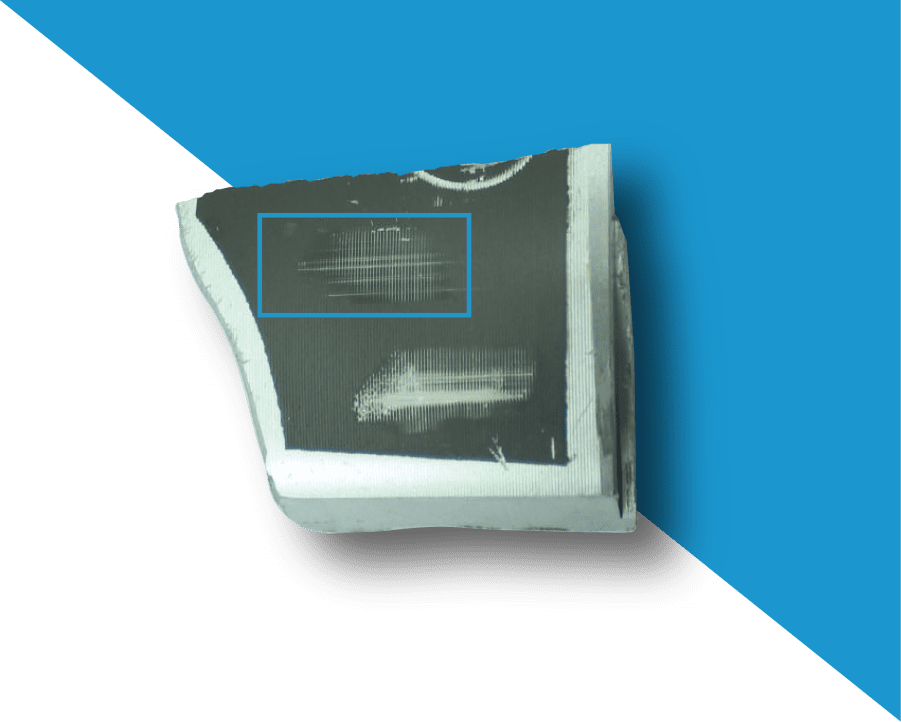
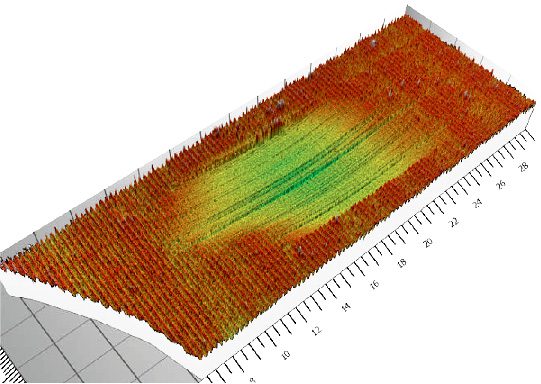
compared to at 90°C. The deep scratches seen on the samples suggest that contact between the static material and the piston skirt occurs frequently throughout the test. The high viscosity at room temperature may be restricting the oil from completely filling gaps at the interfaces and creating metal-metal contact. At higher temperature, the oil thins and is able to flow between the pin and the piston. As a result, significantly less wear is observed at higher temperature. FIGURE 5 shows one side of the wear scar wore significantly less than the other side. This is most likely due to the location of the oil output. The lubricant film thickness was thicker on one side than the other, causing uneven wearing.


[2] “5052 Aluminum vs 356.0 Aluminum.” MakeItFrom.com, makeitfrom.com/compare/5052-O-Aluminum/A356.0-SG70B-A13560-Cast-Aluminum

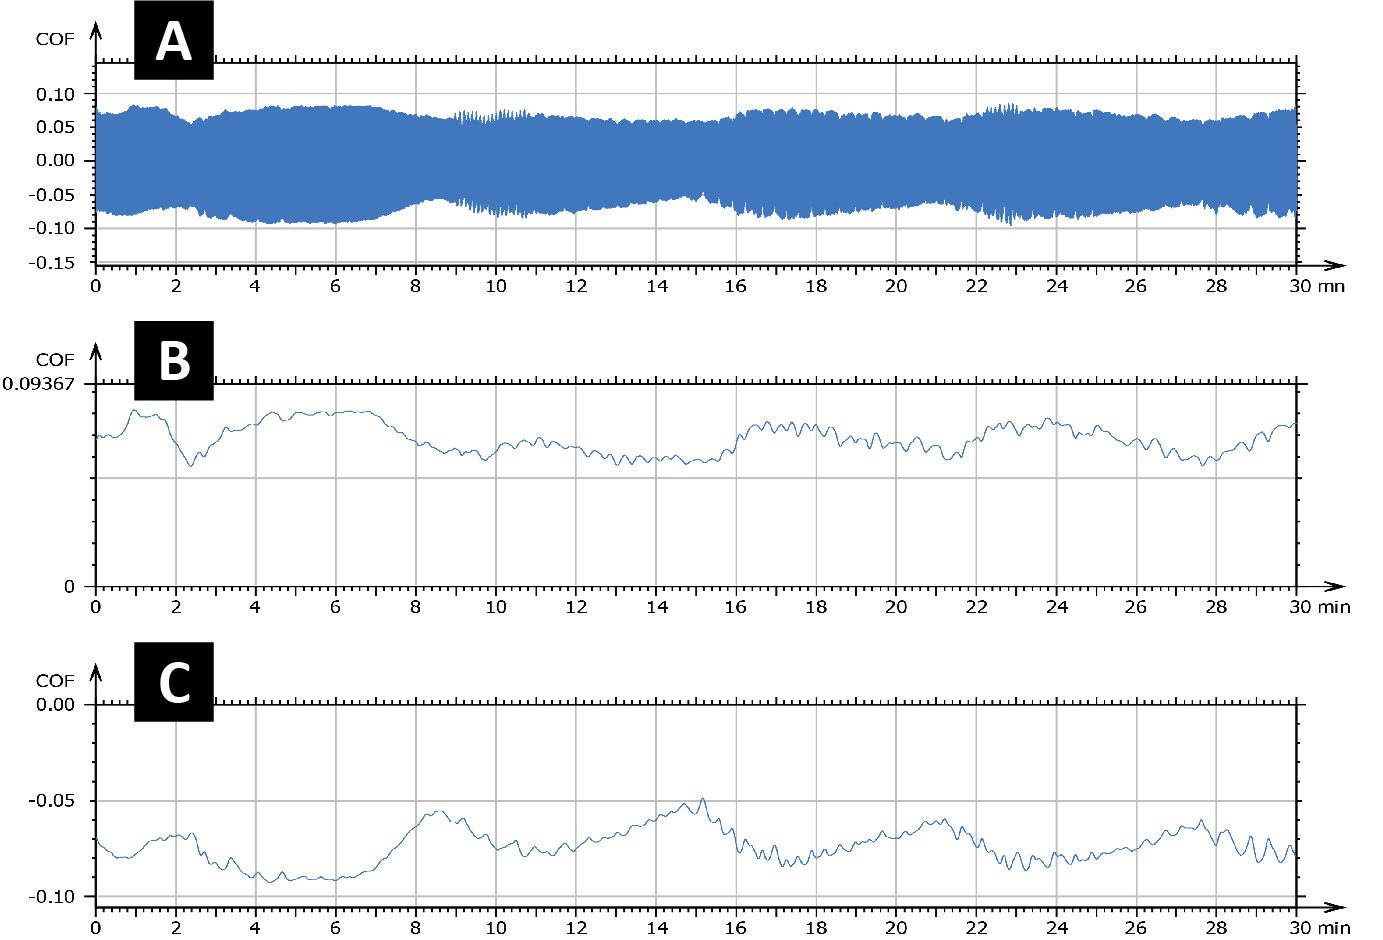
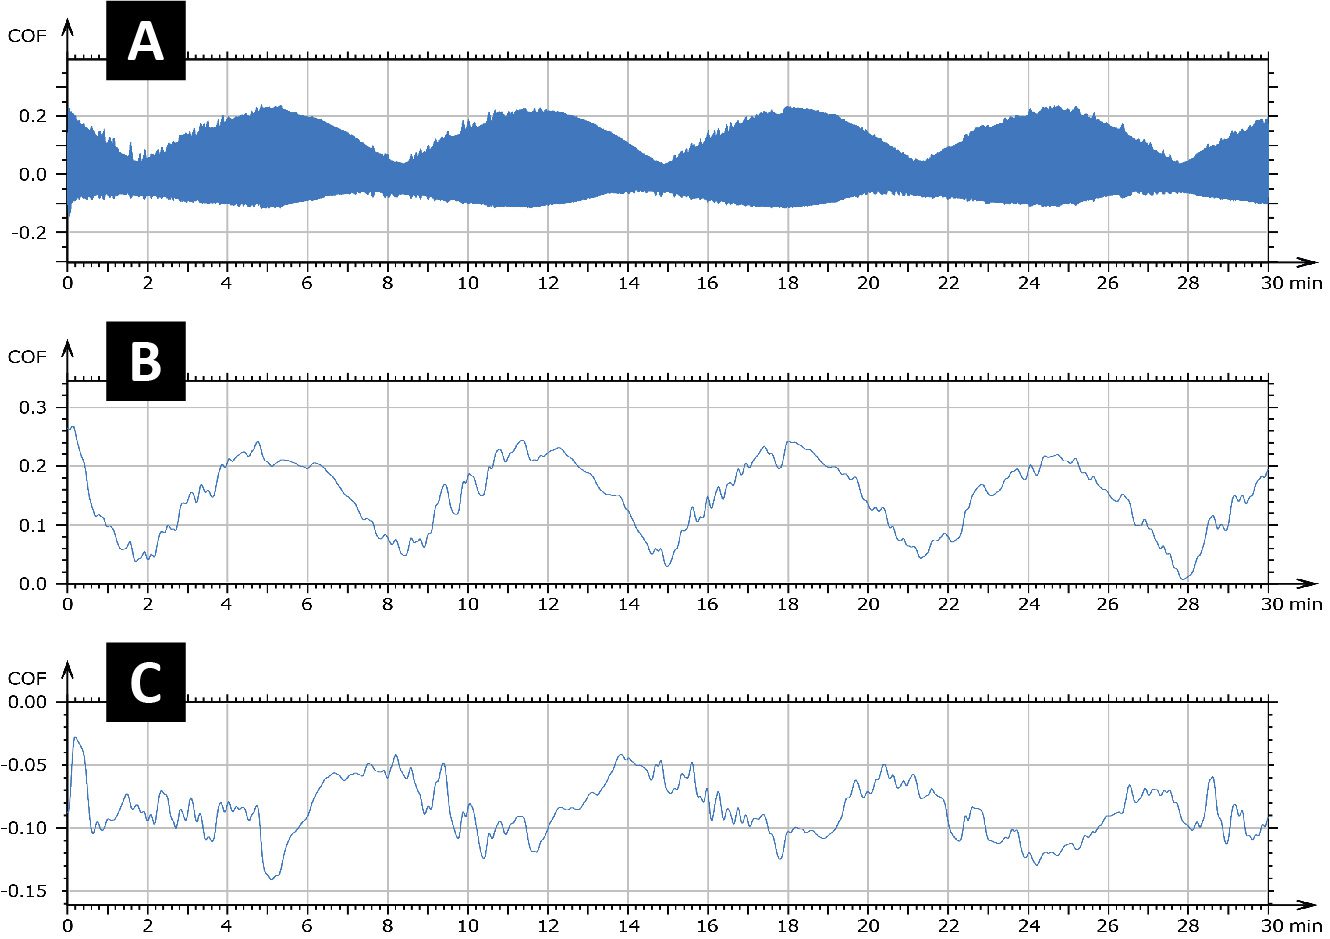
The COF of linear reciprocating tribology tests can be split into a high and low pass. High pass refers to the sample moving in the forward, or positive, direction and low pass refers to the sample moving in the reverse, or negative, direction. The average COF for the RT oil was observed to be under 0.1 for both directions. The average COF between passes were 0.072 and 0.080. The average COF of the 90°C oil was found to be different between passes. Average COF values of 0.167 and 0.09 were observed. The difference in COF gives additional proof that the oil was only able to properly wet one side of the pin. High COF was obtained when a thick film was formed between the pin and the piston skirt due to hydrodynamic lubrication occurring. Lower COF is observed in the other direction when mixed lubrication is occurring. For more information on hydrodynamic lubrication and mixed lubrication, please visit our application note on Stribeck Curves.

Cuadro 1: Results from lubricated wear test on pistons.

FIGURA 1: COF graphs for room temperature oil wear test A raw profile B high pass C low pass.

FIGURA 2: COF graphs for 90°C wear oil test A raw profile B high pass C low pass.

FIGURA 3: Optical image of wear scar from RT motor oil wear test.

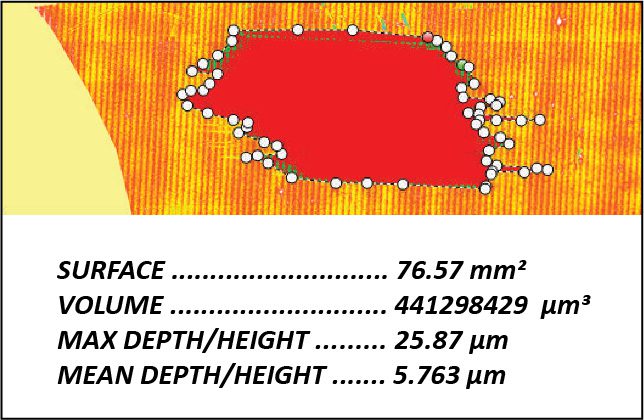
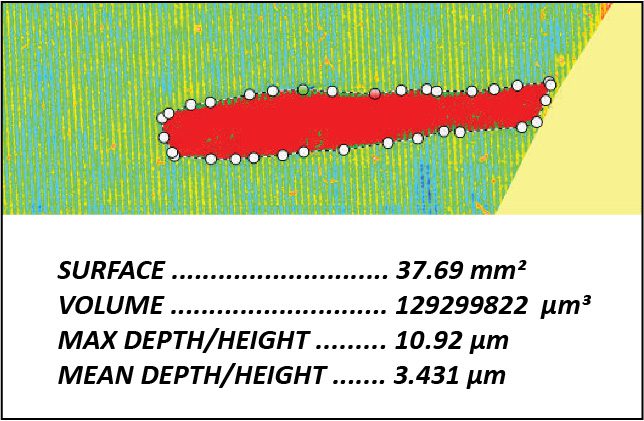
FIGURA 4: Volume of a hole analysis of wear scar from RT motor oil wear test.

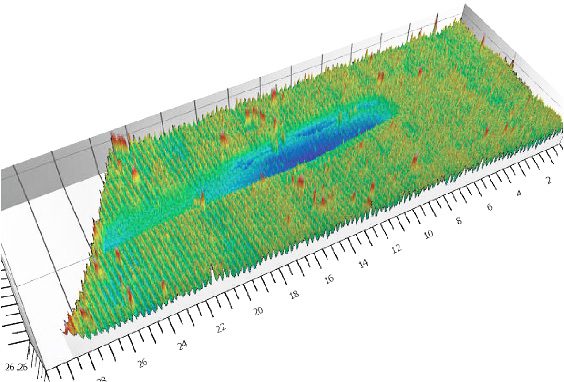
FIGURA 5: Profilometry scan of wear scar from RT motor oil wear test.

FIGURA 6: Optical image of wear scar from 90°C motor oil wear test

FIGURA 7: Volume of a hole analysis of wear scar from 90°C motor oil wear test.

FIGURA 8: Profilometry scan of wear scar from 90°C motor oil wear test.

CONCLUSIÓN

Lubricated linear reciprocating wear testing was conducted on a piston to simulate events occurring in a
real-life operational engine. The piston skirt-lubricant-cylinder liner interfaces is crucial to the operations of an engine. The lubricant thickness at the interface is responsible for energy loss due to friction or wear between the piston skirt and cylinder liner. To optimize the engine, the film thickness must be as thin as possible without allowing the piston skirt and cylinder liner to touch. The challenge, however, is how changes in temperature, speed, and force will affect the P-L-C interfaces.

With its wide range of loading (up to 2000 N) and speed (up to 15000 rpm), the NANOVEA T2000 tribometer is able to simulate different conditions possible in an engine. Possible future studies on this topic include how the P-L-C interfaces will behave under different constant load, oscillated load, lubricant temperature, speed, and lubricant application method. These parameters can be easily adjusted with the NANOVEA T2000 tribometer to give a complete understanding on the mechanisms of the piston skirt-lubricant-cylinder liner interfaces.

AHORA, HABLEMOS DE SU SOLICITUD

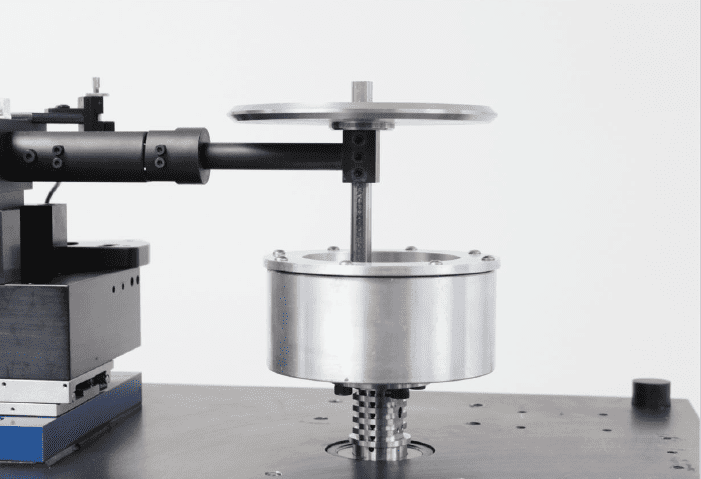
Continuous Stribeck Curve Measurement using Pin-on-Disk Tribometer

Introducción:

When lubrication is applied to reduce the wear/friction of moving surfaces, the lubrication contact at the interface can shift from several regimes such as Boundary, Mixed and Hydrodynamic Lubrication. The thickness of the fluid film plays a major role in this process, mainly determined by the fluid viscosity, the load applied at the interface and the relative speed between the two surfaces. How the lubrication regimes react to friction is shown in what is called a Stribeck [1-4] curve.

In this study we demonstrate for the first time the ability to measure a continuous Stribeck Curve. Using the Nanovea Tribómetro advanced step-less speed control, from 15000 to 0.01 rpm, within 10 minutes the software directly provides a complete Stribeck Curve. The simple initial setup only requires users to select the Exponential Ramp Mode and enter initial and final speeds, rather than having to perform multiple tests or program a stepwise procedure at different speeds requiring data stitching for the conventional Stribeck curve measurements. This advancement provides precise data throughout lubricant regime evaluation and substantially reduces time and cost. The test shows a great potential to be used in different industrial engineering applications.


Click to read more!

Lubricating Eye Drop Comparison using the Nanovea T50 Tribometer

Importance of Testing Eye Drop Solutions

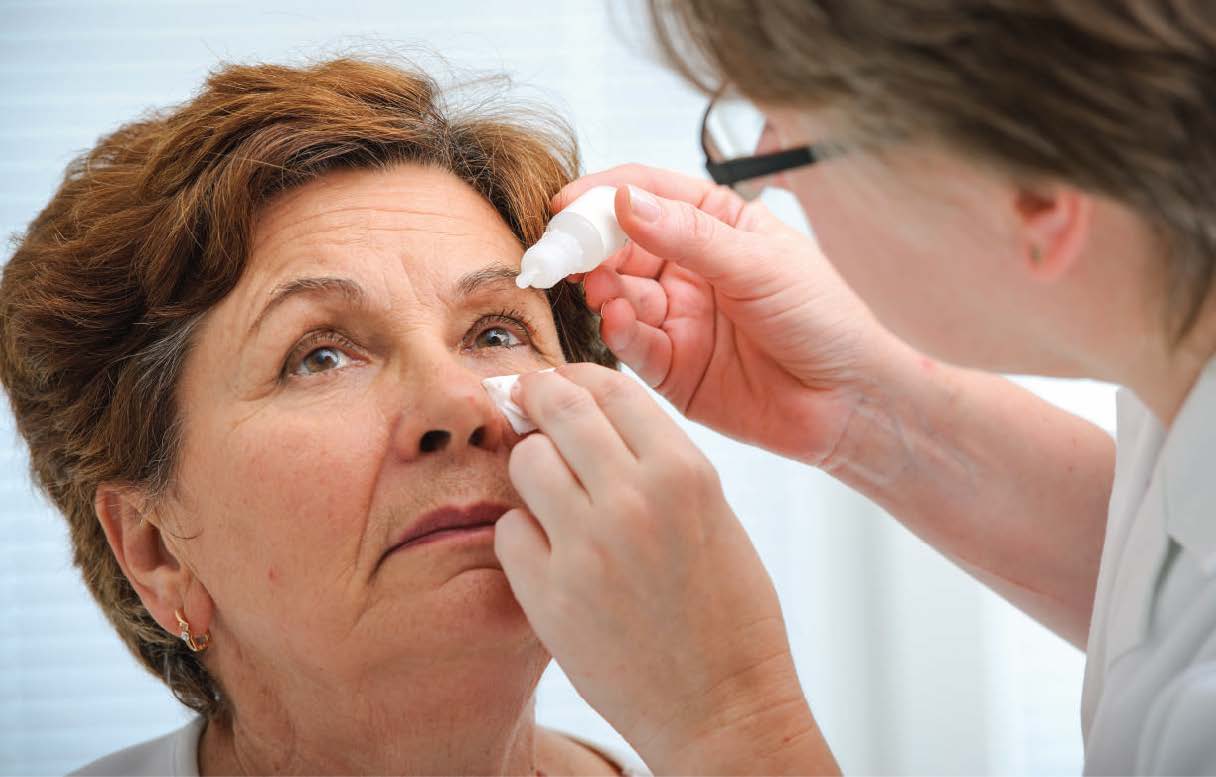
Eye drop solutions are used to alleviate symptoms caused by a range of eye problems. For example, they can be used to treat minor eye irritation (e.g. dryness and redness), delay the onset of glaucoma or treat infections. Eye drop solutions sold over-the-counter are mainly used to treat dryness. Their effectiveness in lubricating the eye can be compared and measured with a coefficient of friction test.
 
Dry eyes can be caused by a wide range of factors, for example, computer eye strain or being outdoors in extreme weather conditions. Good lubricating eye drops help maintain and supplement the moisture on the outer surface of the eyes. This works to alleviate the discomfort, burning or irritation and redness associated with dry eyes. By measuring the coefficient of friction (COF) of an eye drop solution, its lubricating efficiency and how it compares to other solutions can be determined.

Objetivo de medición

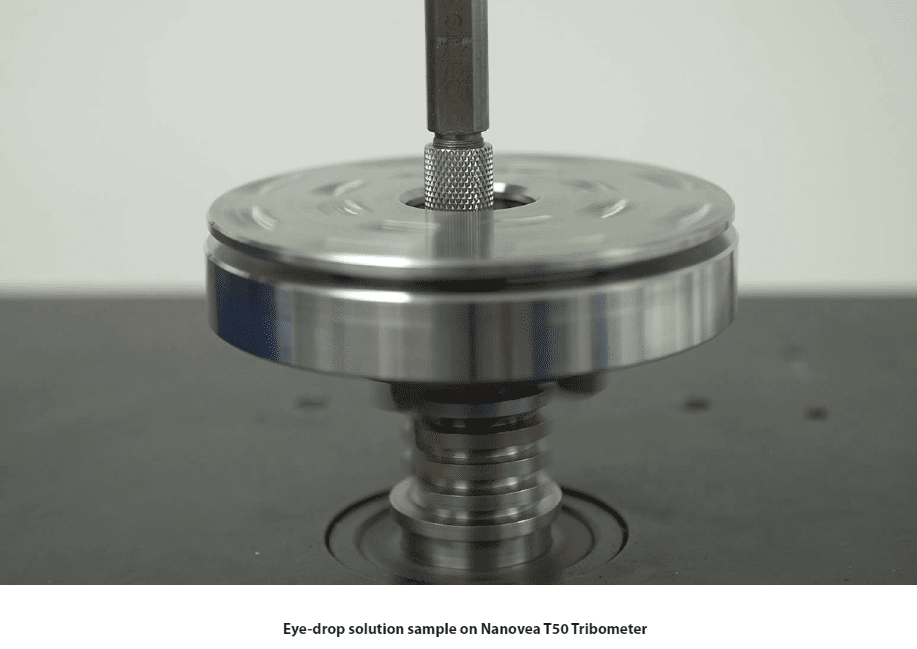
In this study, the coefficient of friction (COF) of three different lubricating eye drop solutions was measured using the pin-on-disk setup on the Nanovea T50 Tribometer.

Procedimiento de ensayo y procedimientos

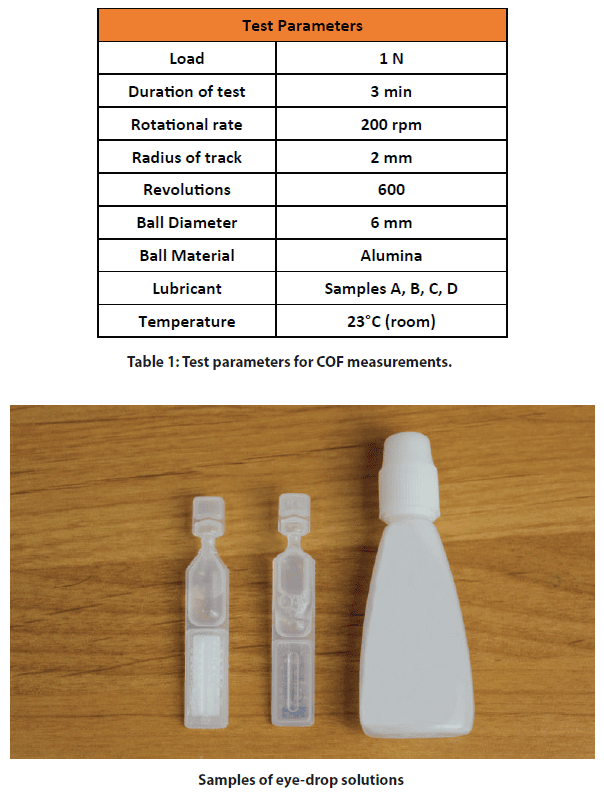
A 6mm diameter spherical pin made of alumina was applied to a glass slide with each eye drop solution acting as the lubricant between the two surfaces. The test parameters used for all experiments are summarized in Table 1 below.

Resultados y debate

The maximum, minimum, and average coefficient of friction values for the three different eye drop solutions tested are tabulated in Table 2 below. The COF v. Revolutions graphs for each eye drop solution are depicted in Figures 2-4. The COF during each test remained relatively constant for most of the total test duration. Sample A had the lowest average COF indicating it had the best lubrication properties.


Conclusión

In this study we showcase the capability of the Nanovea T50 Tribometer in measuring the coefficient of friction of three eye drop solutions. Based on these values, we show that Sample A had a lower coefficient of friction and therefore exhibits better lubrication in comparison to the other two samples.

Nanovea Tribómetros offers precise and repeatable wear and friction testing using ISO and ASTM compliant rotative and linear modules. It also provides optional high temperature wear, lubrication, and tribo-corrosion modules available in one pre-integrated system. Such versatility allows users to better simulate the real application environment and improve fundamental understanding of the wear mechanism and tribological characteristics of various materials.

AHORA, HABLEMOS DE SU SOLICITUD

Brush Bristle Stiffness Performance Using Tribometer

Brushes are among the most basic and widely used tools in the world. They can be used to remove material (toothbrush, archaeological brush, bench grinder brush), apply material (paintbrush, makeup brush, gilding brush), comb filaments, or add a pattern. As a result of the mechanical and abrasive forces on them, brushes constantly have to be replaced after moderate use. For example toothbrush heads should be replaced every three to four months because of fraying as a result of repeated usage. Making the toothbrush fiber filaments too stiff risks wearing away the actual tooth instead of soft plaque. Making the toothbrush fibers too soft makes the brush lose its form faster. Understanding the changing bend of the brush, as well as the wear and overall change in shape in the filaments under different loading conditions is necessary to design brushes that better fulfill their application.

Brush Bristle Stiffness Performance Using Tribometer