Archivos mensuales: septiembre 2019
Rugosidad superficial y características de una célula solar
Importancia de las pruebas de los paneles solares
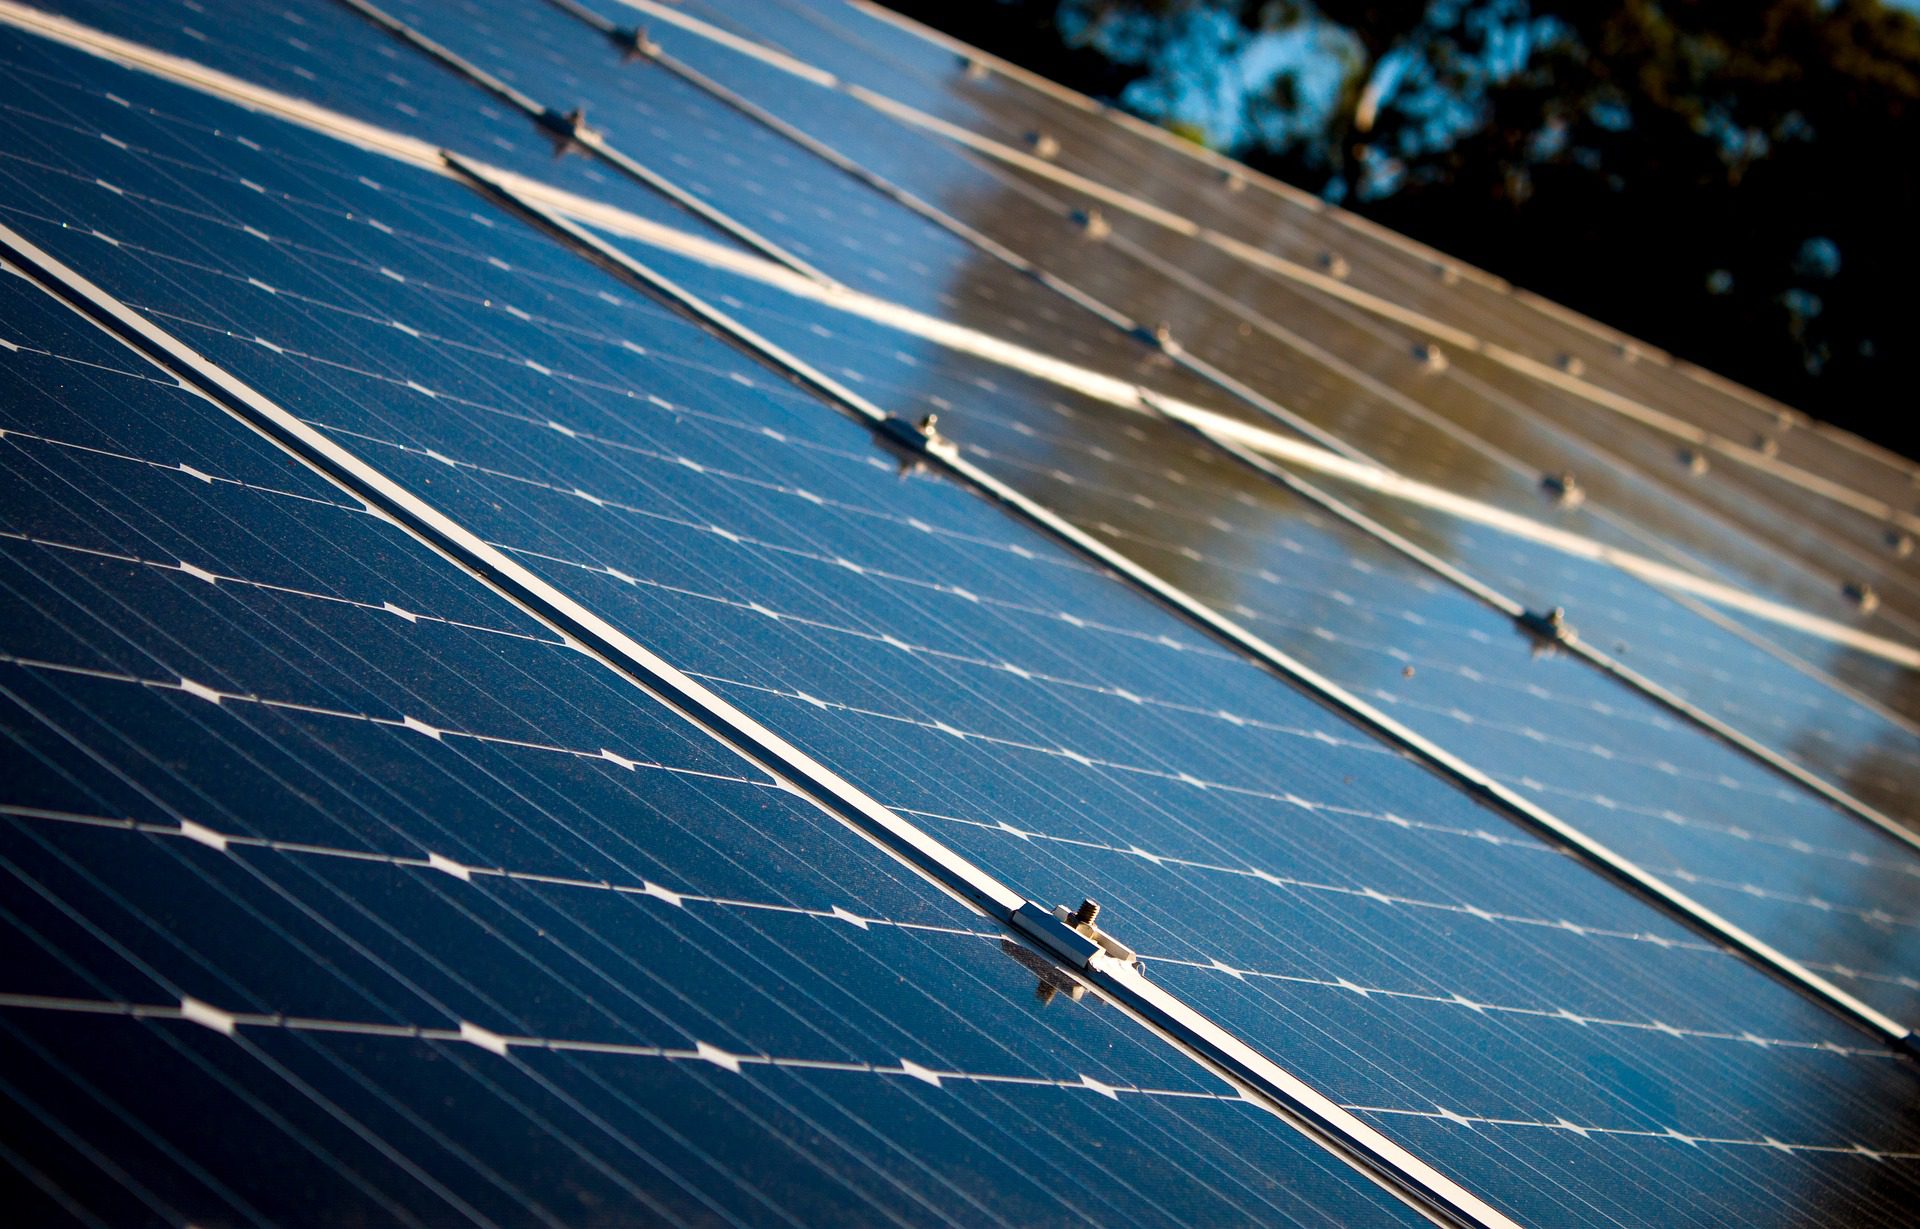
Maximizar la absorción de energía de una célula solar es clave para la supervivencia de la tecnología como recurso renovable. Las múltiples capas de recubrimiento y protección de vidrio permiten la absorción, transmisión y reflexión de la luz necesaria para que las células fotovoltaicas funcionen. Dado que la mayoría de las células solares de consumo operan con una eficiencia de 15-18%, optimizar su producción de energía es una batalla constante.
Los estudios han demostrado que la rugosidad de la superficie desempeña un papel fundamental en la reflectancia de la luz. La capa inicial de vidrio debe ser lo más lisa posible para mitigar la reflectancia de la luz, pero las capas posteriores no siguen esta pauta. Es necesario un cierto grado de rugosidad en cada interfaz de recubrimiento para aumentar la posibilidad de dispersión de la luz dentro de sus respectivas zonas de agotamiento y aumentar la absorción de luz dentro de la célula. La optimización de la rugosidad de la superficie en estas regiones permite que la célula solar funcione al máximo de su capacidad y, con el sensor de alta velocidad Nanovea HS2000, la medición de la rugosidad de la superficie se puede realizar de forma rápida y precisa.
Objetivo de medición
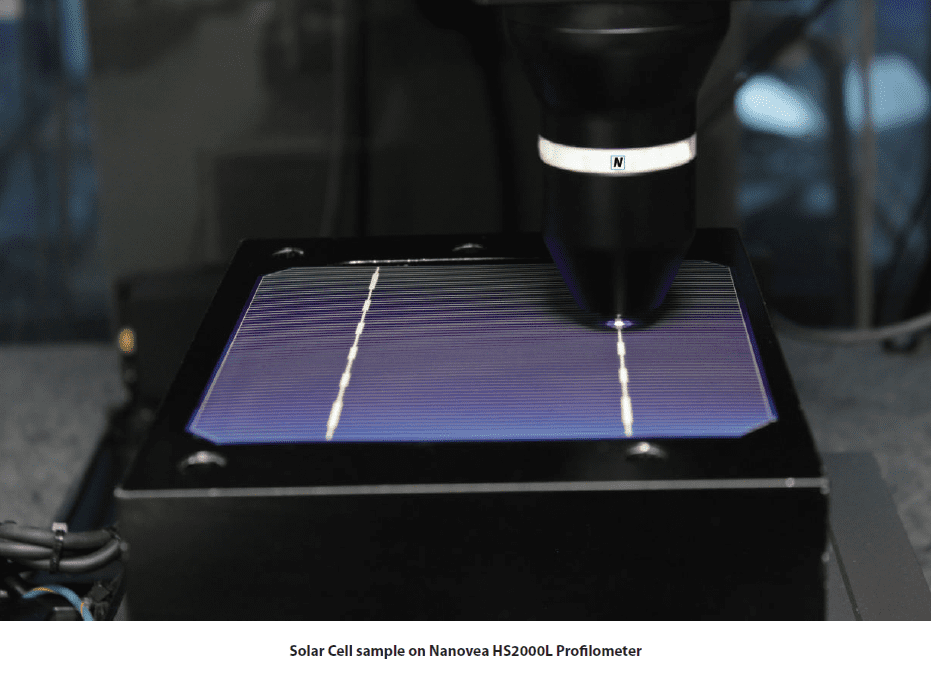
En este estudio mostraremos las capacidades de Nanovea. Perfilómetro HS2000 con sensor de alta velocidad mediante la medición de la rugosidad superficial y las características geométricas de una célula fotovoltaica. Para esta demostración se medirá una célula solar monocristalina sin protección de vidrio, pero la metodología puede utilizarse para otras aplicaciones.
Procedimiento de ensayo y procedimientos
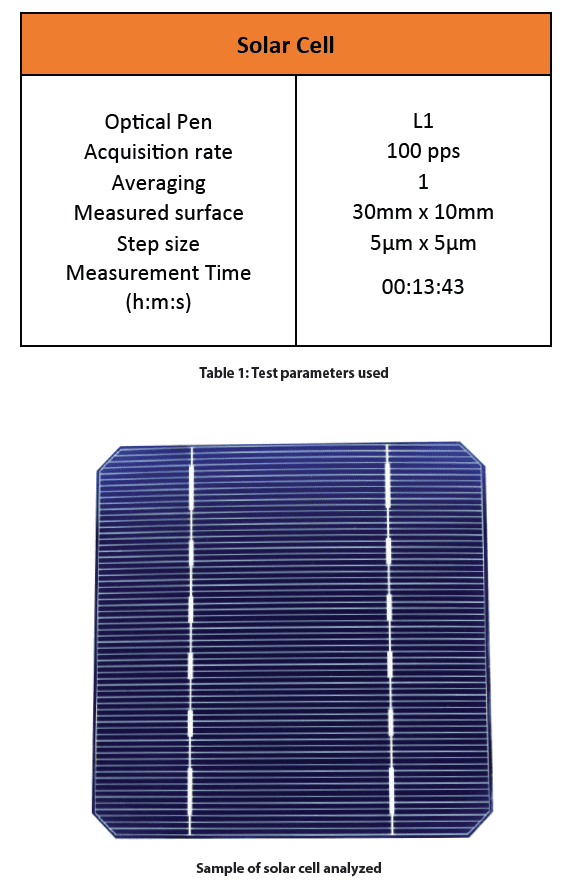
Se utilizaron los siguientes parámetros de prueba para medir la superficie de la célula solar.
Resultados y debate
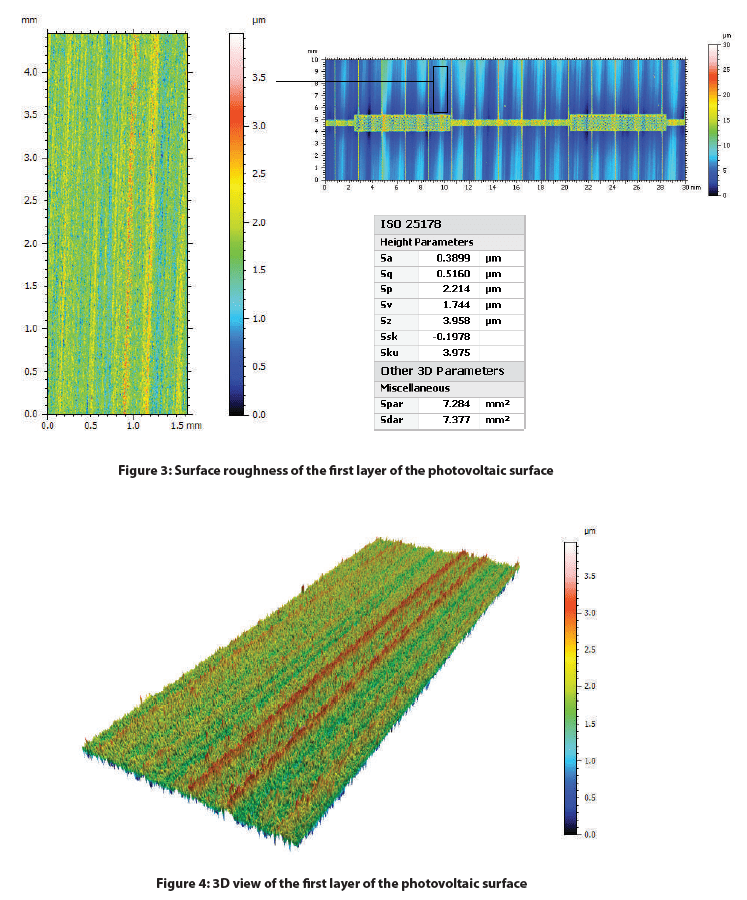
A continuación se muestra la vista en falso color 2D de la célula solar y una extracción del área de la superficie con sus respectivos parámetros de altura. Se aplicó un filtro gaussiano a ambas superficies y se utilizó un índice más agresivo para aplanar el área extraída. Esto excluye las formas (o ondulaciones) mayores que el índice de corte, dejando atrás las características que representan la rugosidad de la célula solar.
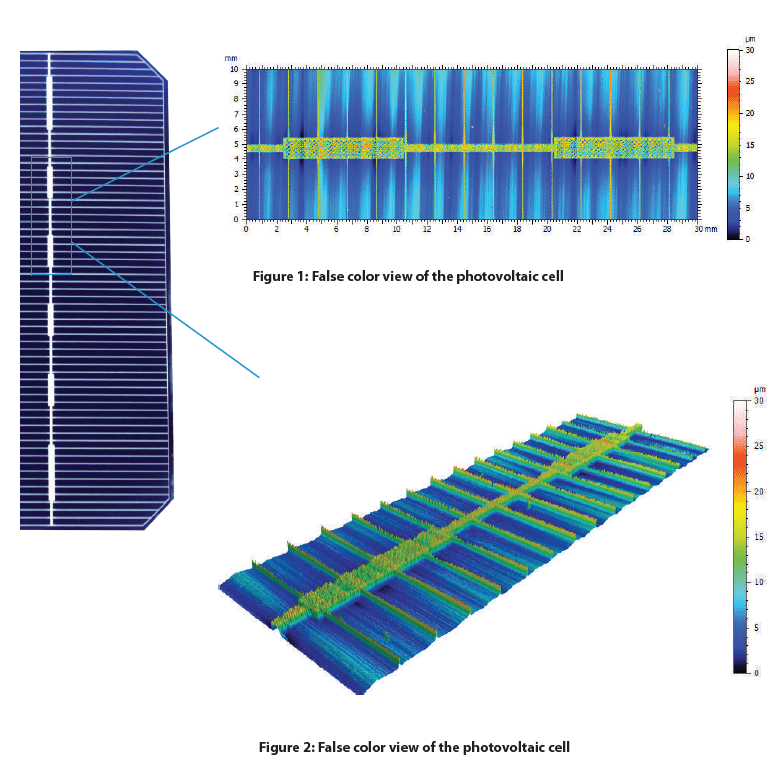
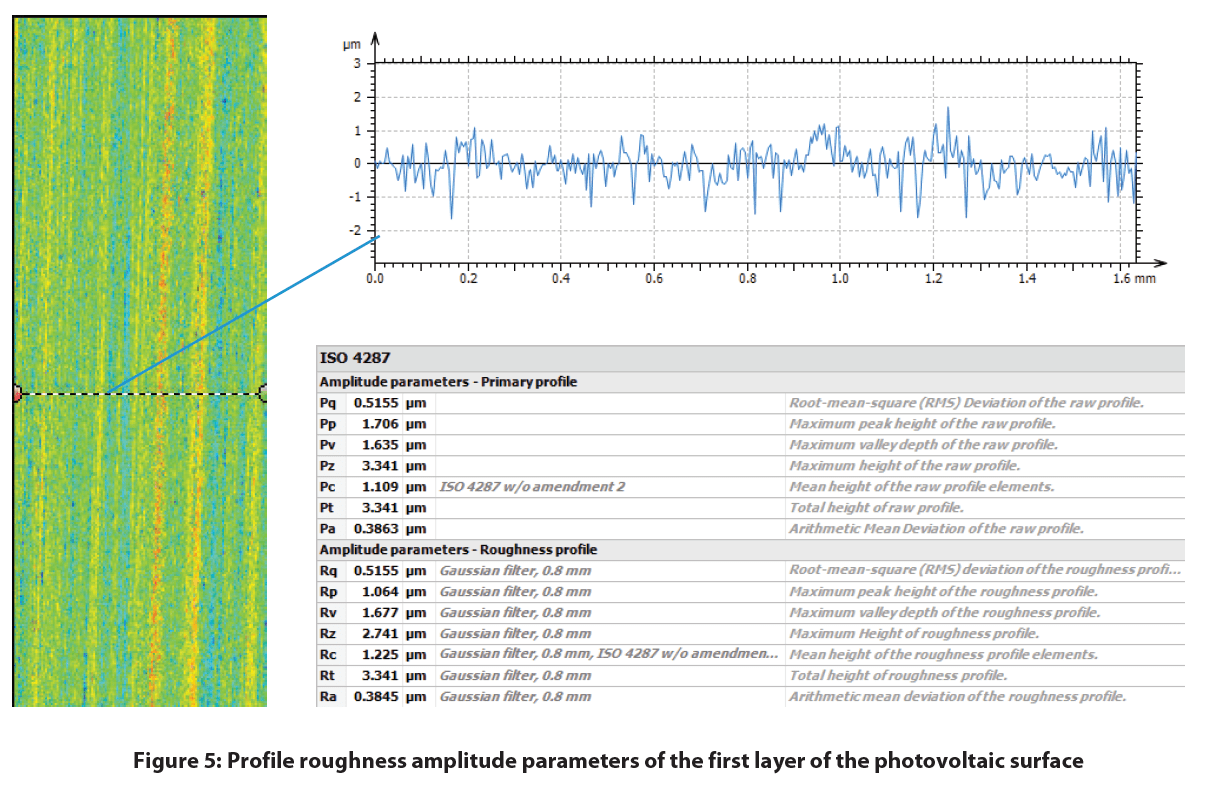
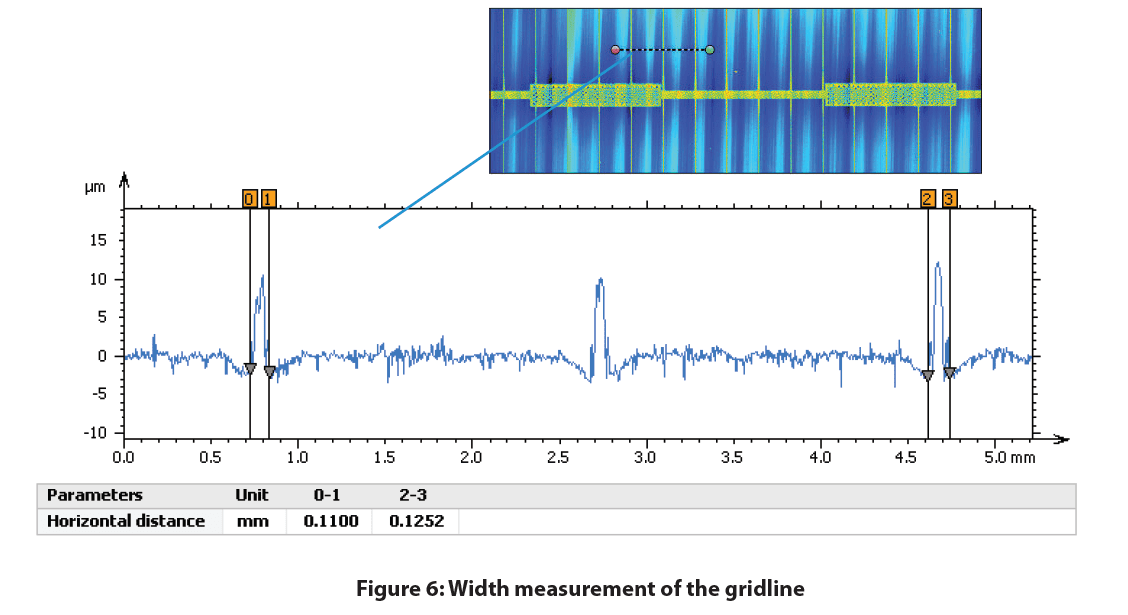
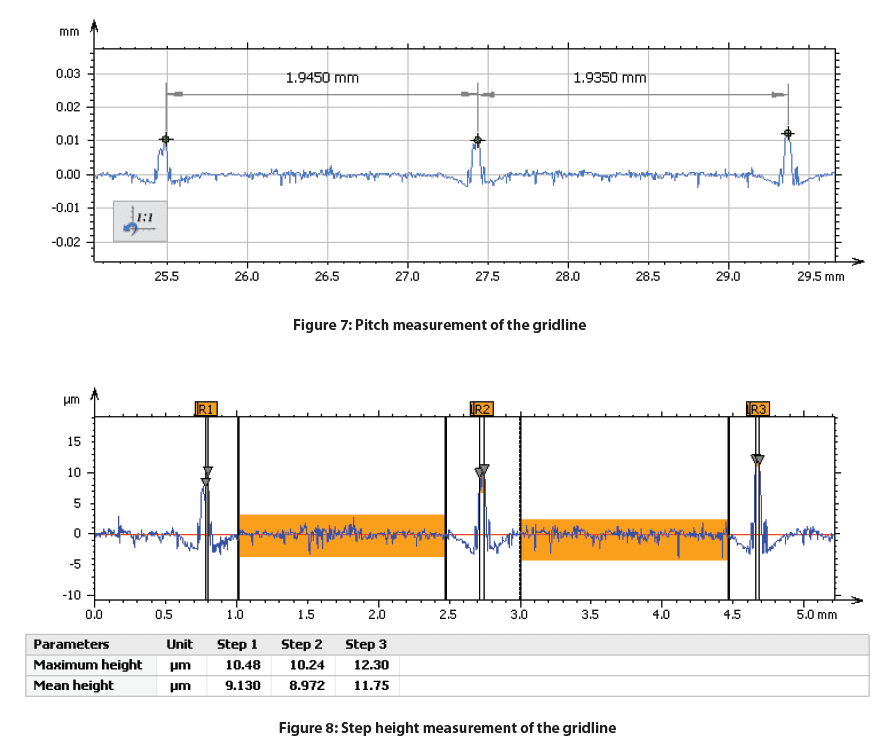
Se tomó un perfil perpendicular a la orientación de las líneas de la rejilla para medir sus características geométricas, como se muestra a continuación. El ancho, la altura y el paso de las líneas de la rejilla se pueden medir para cualquier ubicación específica de la célula solar.
Conclusión

En este estudio, pudimos demostrar la capacidad del sensor lineal Nanovea HS2000 para medir la rugosidad y las características de la superficie de una célula fotovoltaica monocristalina. Con la capacidad de automatizar mediciones precisas de múltiples muestras y establecer límites de aprobación o rechazo, el sensor lineal Nanovea HS2000 es la opción perfecta para las inspecciones de control de calidad.
Referencia
1 Scholtz, Lubomir. Ladanyi, Libor. Mullerova, Jarmila. “Influencia de la rugosidad de la superficie en las características ópticas de las células solares multicapa“. Advances in Electrical and Electronic Engineering, vol. 12, n.º 6, 2014, pp. 631-638.
Comparación de gotas lubricantes para los ojos utilizando el tribómetro Nanovea T50
Importancia de probar las soluciones oftálmicas
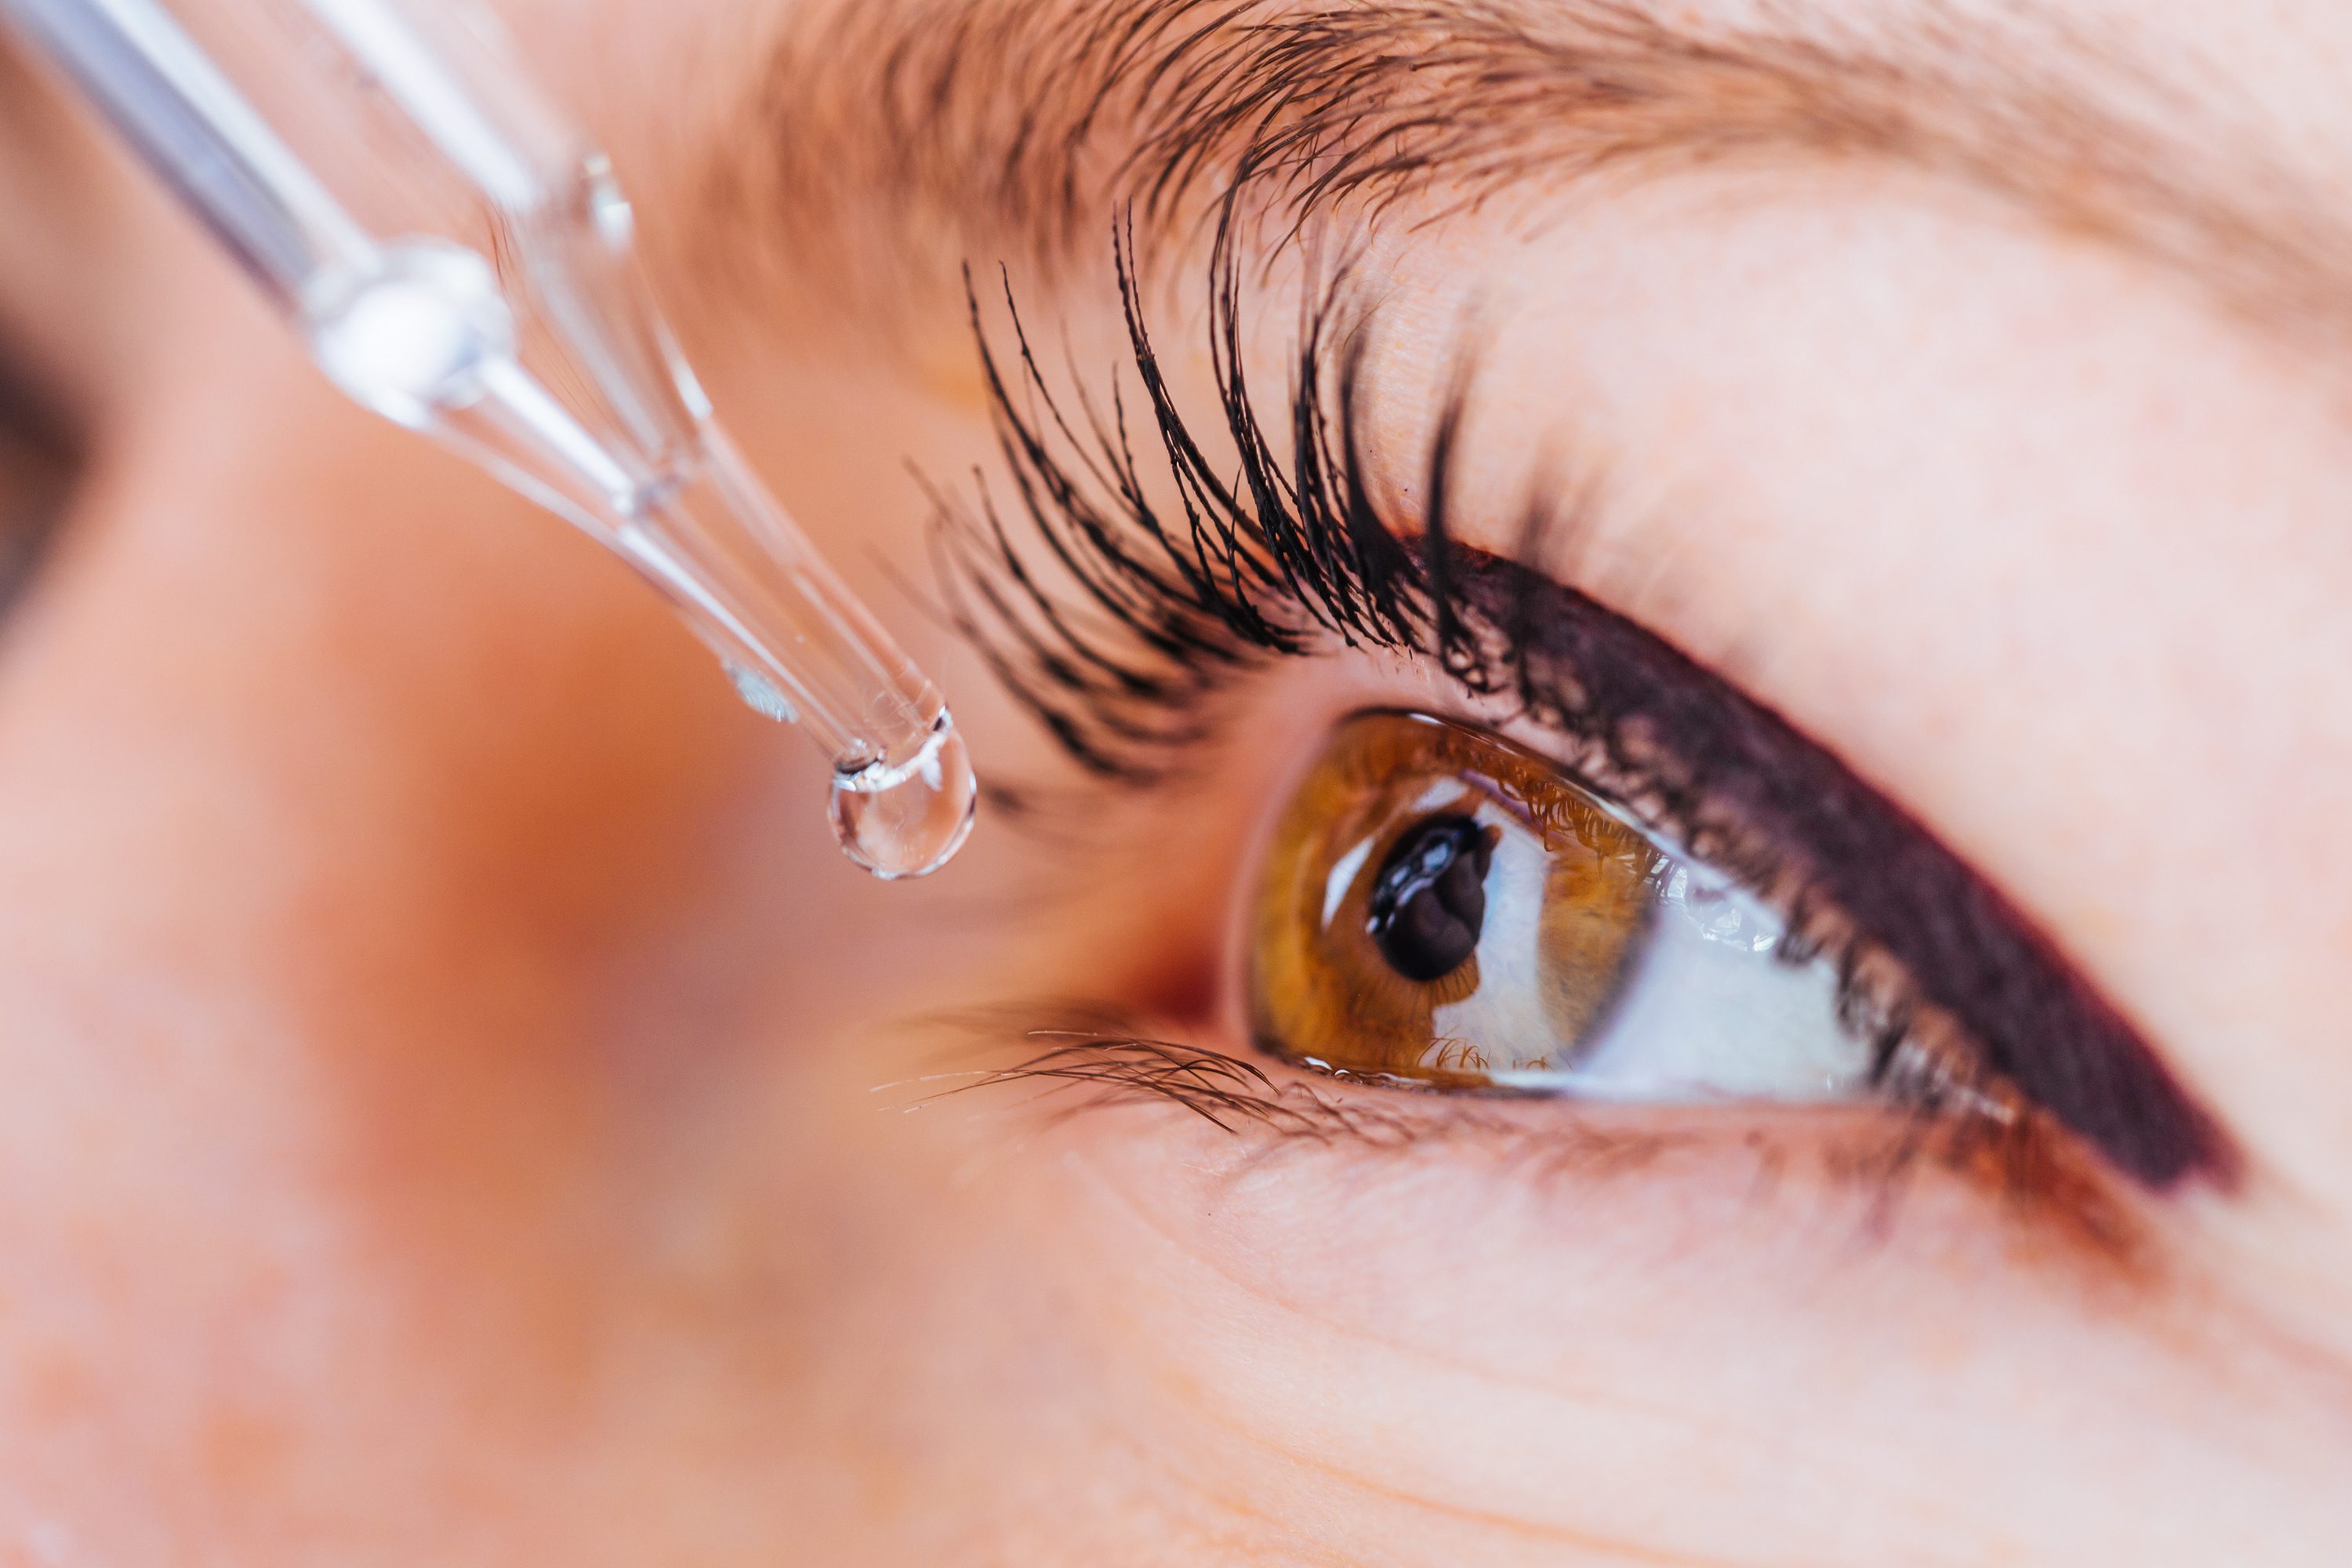
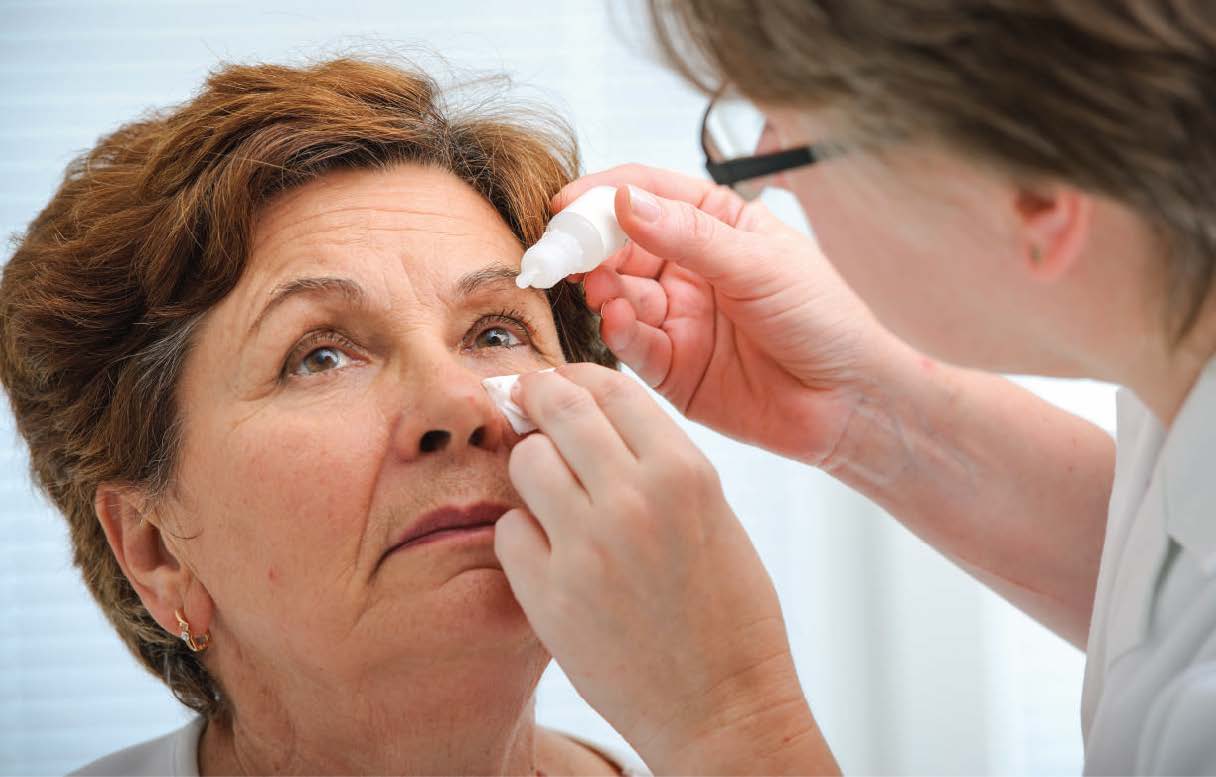
Las soluciones oftálmicas se utilizan para aliviar los síntomas causados por diversos problemas oculares. Por ejemplo, pueden utilizarse para tratar irritaciones oculares leves (como sequedad y enrojecimiento), retrasar la aparición del glaucoma o tratar infecciones. Las soluciones oftálmicas de venta libre se utilizan principalmente para tratar la sequedad. Su eficacia para lubricar el ojo puede compararse y medirse con una prueba de coeficiente de fricción.
La sequedad ocular puede deberse a una amplia variedad de factores, como la fatiga visual por el uso del ordenador o la exposición a condiciones climáticas extremas al aire libre. Unas buenas gotas lubricantes para los ojos ayudan a mantener y complementar la humedad de la superficie externa de los ojos. Esto alivia las molestias, el ardor, la irritación y el enrojecimiento asociados a la sequedad ocular. Mediante la medición del coeficiente de fricción (COF) de una solución oftálmica, se puede determinar su eficacia lubricante y compararla con otras soluciones.
Objetivo de medición
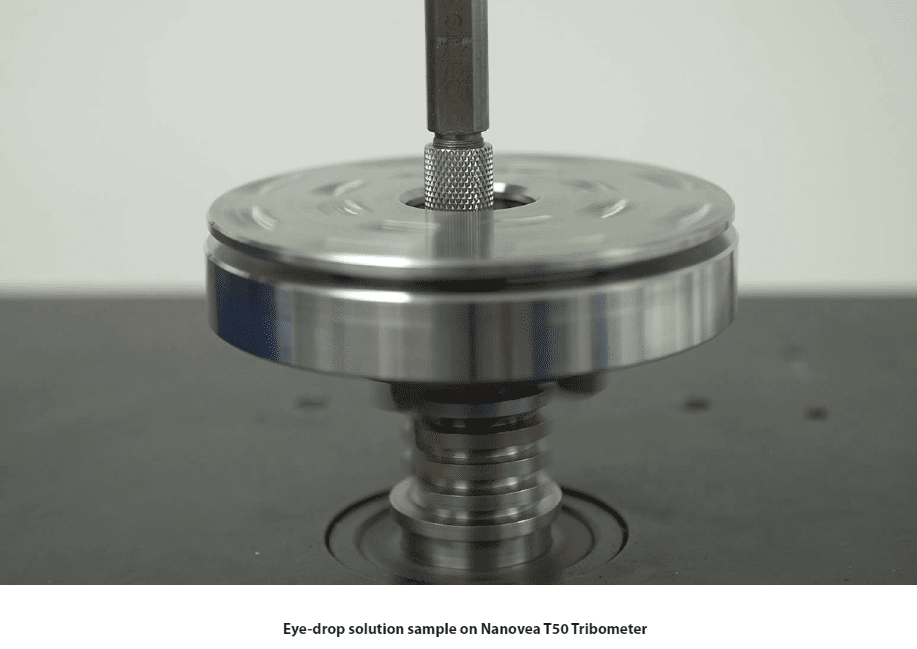
En este estudio, se midió el coeficiente de fricción (COF) de tres soluciones lubricantes diferentes para gotas oftálmicas utilizando la configuración de pin sobre disco en el tribómetro Nanovea T50.
Procedimiento de ensayo y procedimientos
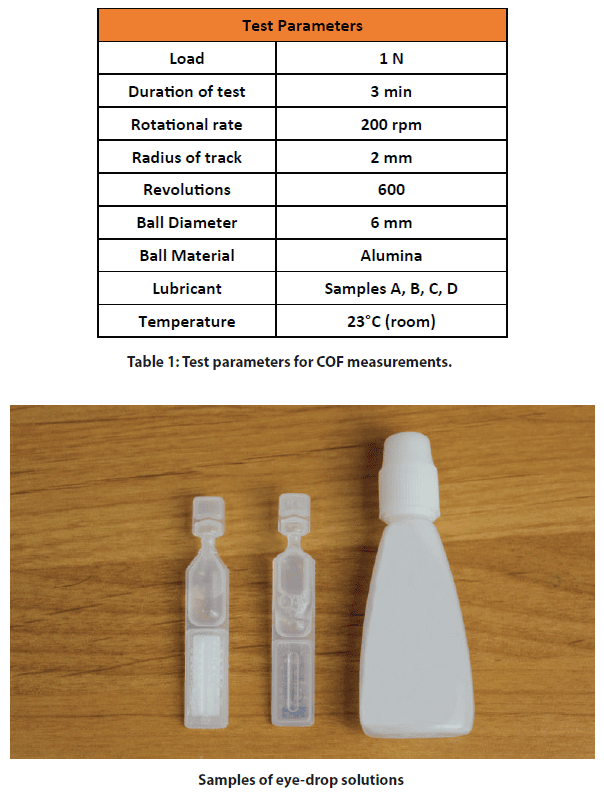
Se aplicó un pasador esférico de alúmina de 6 mm de diámetro a un portaobjetos de vidrio, utilizando cada solución oftálmica como lubricante entre las dos superficies. Los parámetros de prueba utilizados en todos los experimentos se resumen en la tabla 1 a continuación.
Resultados y debate
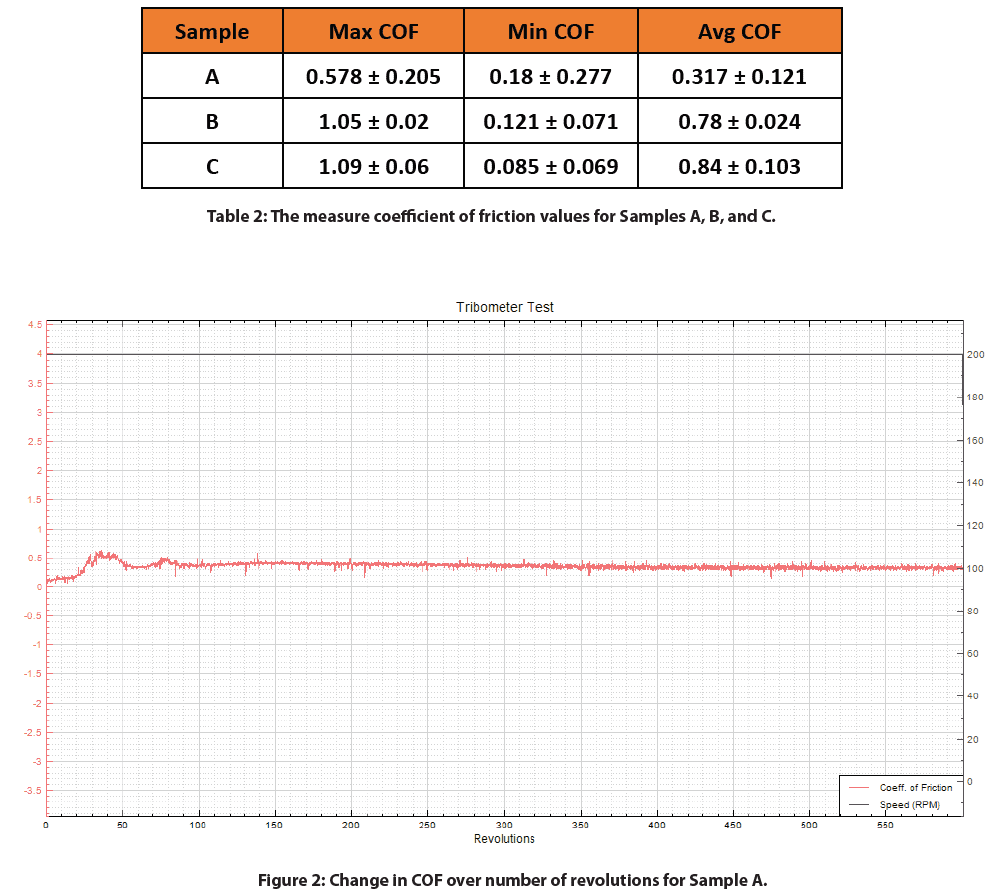
Los valores máximos, mínimos y medios del coeficiente de fricción para las tres soluciones oftálmicas diferentes probadas se recogen en la tabla 2 a continuación. Los gráficos del COF frente a las revoluciones para cada solución oftálmica se muestran en las figuras 2-4. El COF durante cada prueba se mantuvo relativamente constante durante la mayor parte de la duración total de la prueba. La muestra A tuvo el COF medio más bajo, lo que indica que tenía las mejores propiedades lubricantes.
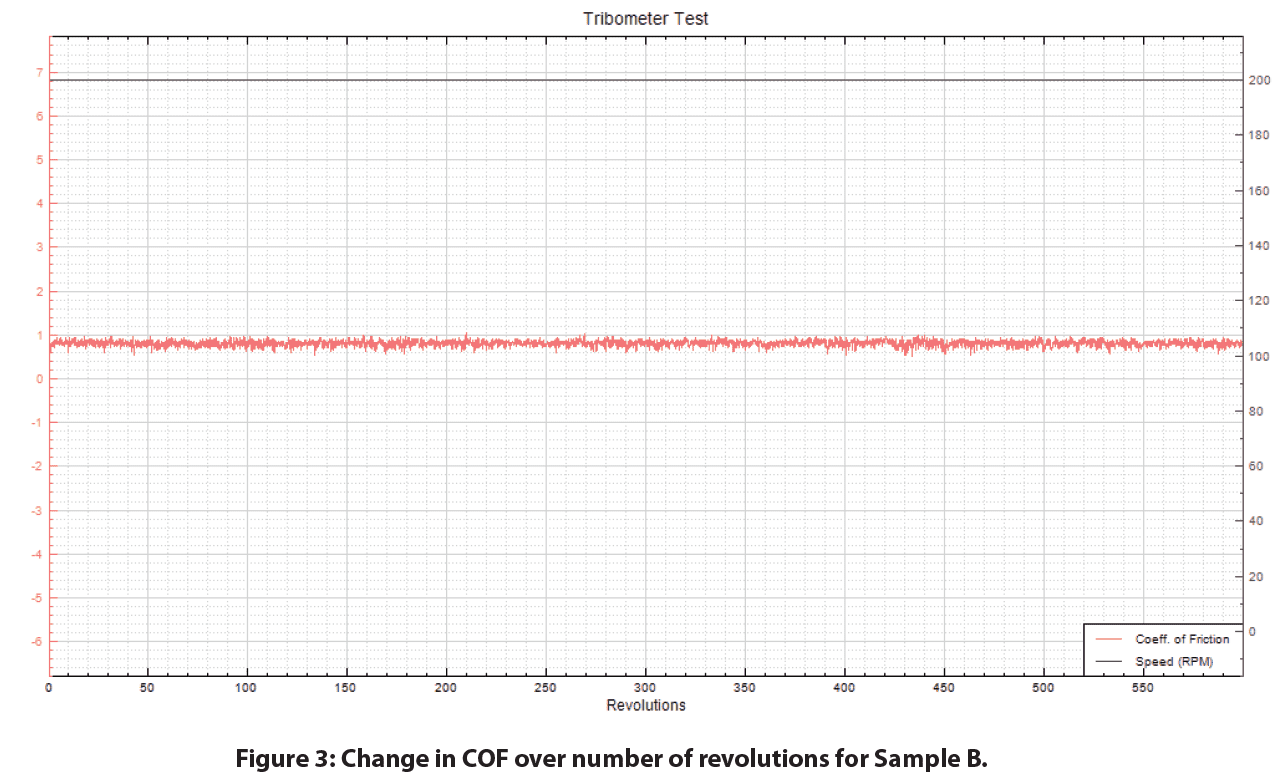
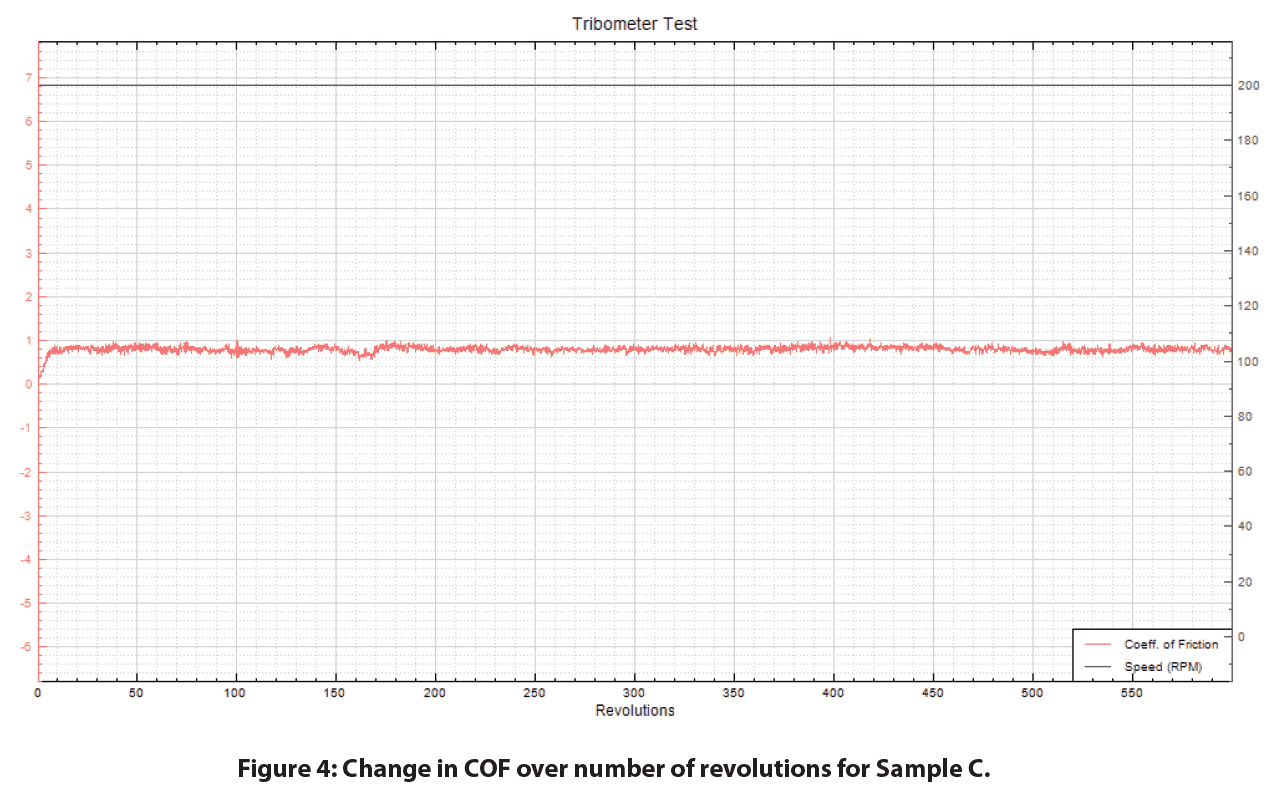
Conclusión
En este estudio mostramos la capacidad del tribómetro Nanovea T50 para medir el coeficiente de fricción de tres soluciones oftálmicas. A partir de estos valores, demostramos que la muestra A tenía un coeficiente de fricción más bajo y, por lo tanto, presentaba una mejor lubricación en comparación con las otras dos muestras.
Nanovea Tribómetros ofrece pruebas de desgaste y fricción precisas y repetibles utilizando módulos rotativos y lineales que cumplen con las normas ISO y ASTM. También proporciona módulos opcionales de desgaste a alta temperatura, lubricación y tribocorrosión disponibles en un sistema preintegrado. Esta versatilidad permite a los usuarios simular mejor el entorno de aplicación real y mejorar la comprensión fundamental del mecanismo de desgaste y las características tribológicas de diversos materiales.


