用非接触式轮廓仪对硬币的三维表面进行分析
非接触式轮廓测量法对钱币的重要性
货币在现代社会中具有很高的价值,因为它可以用来交换商品和服务。硬币和纸币在许多人的手中流通。实物货币的不断转移会造成表面变形。纳诺维亚的 3D 轮廓仪 扫描不同年份铸造的硬币的地形,以研究表面差异。
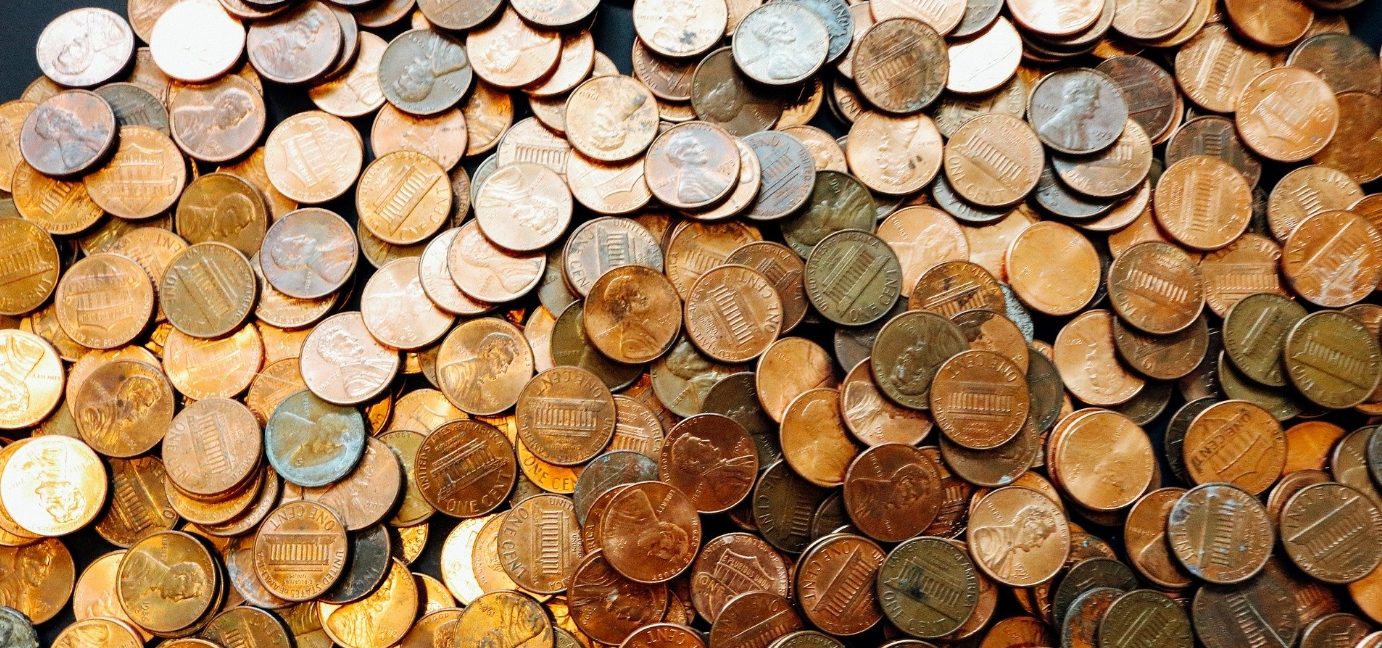
硬币特征很容易为公众所识别,因为它们是常见的物体。花一分钱就能了解 Nanovea 高级表面分析软件的优势:Mountains 3D。使用我们的 3D 轮廓仪收集的表面数据可以通过表面减法和 2D 轮廓提取对复杂的几何形状进行高级分析。使用受控掩模、印模或模具进行表面减法可比较制造工艺的质量,而轮廓提取可通过尺寸分析来识别公差。 Nanovea 的 3D 轮廓仪和 Mountains 3D 软件可研究看似简单物体(如便士)的亚微米形貌。
测量目标
使用Nanovea公司的高速线传感器扫描了五枚硬币的整个上表面。每枚硬币的内外半径都是用Mountains高级分析软件测量的。从感兴趣区域的每个硬币表面提取直接表面减法量化表面变形。
结果和讨论
三维表面
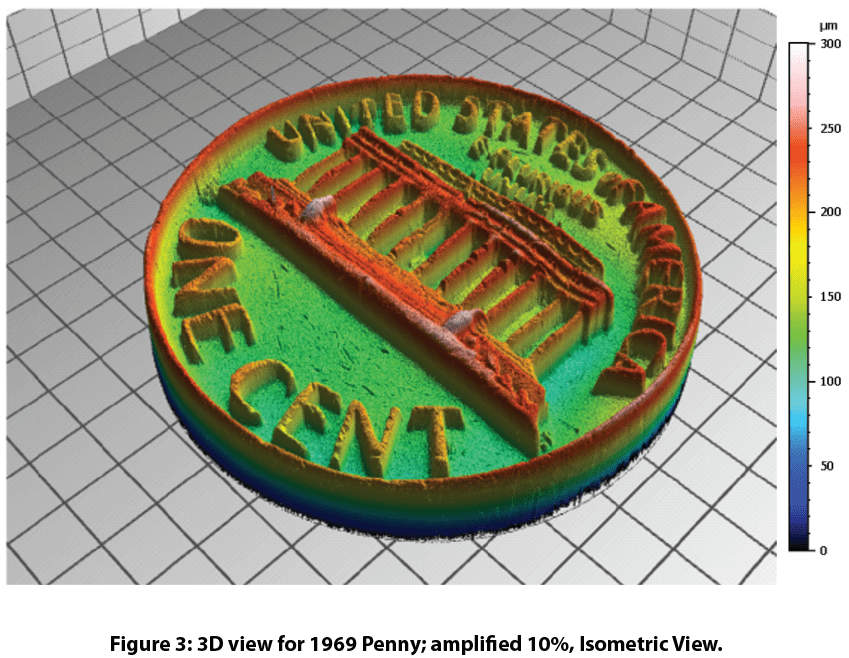
Nanovea HS2000轮廓仪仅用24秒就扫描了一个20mm x 20mm区域的400万个点,步长为10um x 10um,获得了一枚硬币的表面。下面是扫描的高度图和3D可视化图。3D视图显示了高速传感器捕捉肉眼无法察觉的小细节的能力。硬币表面有许多细小的划痕。研究了硬币在三维视图中看到的纹理和粗糙度。
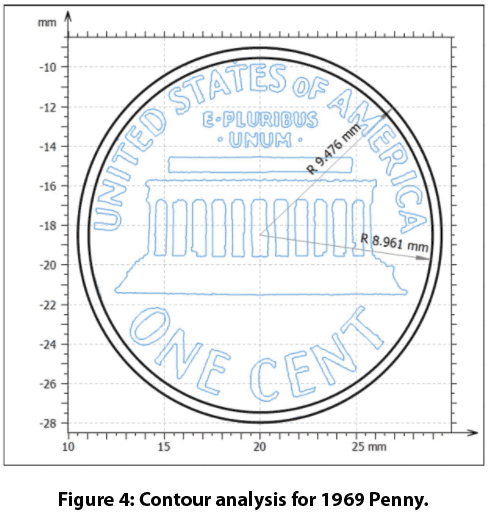
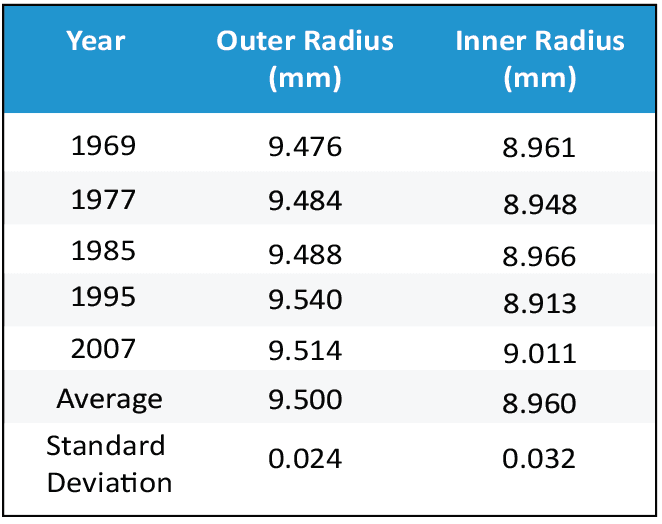
提取了便士的轮廓,通过尺寸分析得到了边缘特征的内径和外径。外半径平均为9.500 mm ± 0.024,而内半径平均为8.960 mm ± 0.032。Mountains 3D可以对二维和三维数据源进行额外的尺寸分析,包括距离测量、台阶高度、平面度和角度计算。
图5显示了表面减法分析所关注的区域。2007年的便士被用作四个旧便士的参考表面。从2007年的分币表面减去,显示出有孔/峰的分币之间的差异。总的表面体积差是由孔/峰的体积相加得到的。均方根误差指的是分币表面相互之间的吻合程度。
总结

Nanovea的高速HS2000L扫描了5枚不同年份铸造的便士。Mountains 3D软件使用轮廓提取、尺寸分析和表面减法来比较每枚硬币的表面。该分析明确了硬币之间的内、外半径,同时直接比较了表面特征的差异。Nanovea的3D轮廓仪能够测量任何纳米级分辨率的表面,结合Mountains的3D分析能力,可能的研究和质量控制应用是无限的。
现在,让我们来谈谈你的申请
分类
- 应用说明
- 环形摩擦学座谈会
- 腐蚀摩擦学
- 摩擦测试|摩擦系数
- 高温机械测试
- 高温摩擦学
- 湿度和气体 摩擦学
- 湿度的机械测试
- 压痕|蠕变和松弛
- 压痕|断裂韧性
- 压痕 | 硬度和弹性
- 压痕|损失和储存
- 压痕 | 应力与应变
- 压痕|屈服强度和疲劳
- 实验室测试
- 线性摩擦学
- 液体机械测试
- 液体摩擦学
- 低温摩擦学
- 机械测试
- 新闻发布
- 轮廓测量 - 平面度和翘曲度
- 轮廓测量法 | 几何和形状
- 轮廓测量 - 粗糙度和光洁度
- 轮廓测量法|台阶高度和厚度
- 轮廓测量法 | 纹理和颗粒
- 轮廓测量法|体积和面积
- 轮廓仪测试
- 环对环摩擦学
- 旋转摩擦学
- 刮擦测试|胶粘剂失效
- 刮擦测试 | 粘着性失效
- 刮擦测试 | 多次磨损
- 划痕测试|划痕硬度
- 划痕测试 摩擦学
- 摩擦学测试
- 未分类
归档
- 2025年11 月
- 2023年9 月
- 2023年8 月
- 2023年6 月
- 2023年5 月
- 2022年7 月
- 2022年5 月
- 2022年4 月
- 2022年1 月
- 2021年12 月
- 2021年11 月
- 2021年10 月
- 2021年9 月
- 2021年8 月
- 2021年7 月
- 2021年6 月
- 2021年5 月
- 2021年3 月
- 2021年2 月
- 2020年12 月
- 2020年11 月
- 2020年10 月
- 2020年9 月
- 2020年7 月
- 2020年5 月
- 2020年4 月
- 2020年3 月
- 2020年2 月
- 2020年1 月
- 2019年11 月
- 2019年10 月
- 2019年9 月
- 2019年8 月
- 2019年7 月
- 2019年6 月
- 2019年5 月
- 2019年4 月
- 2019年3 月
- 2019年1 月
- 2018年12 月
- 2018年11 月
- 2018年10 月
- 2018年9 月
- 2018年7 月
- 2018年6 月
- 2018年4 月
- 2018年3 月
- 2018年2 月
- 2017年11 月
- 2017年10 月
- 2017年9 月
- 2017年8 月
- 2017年6 月
- 2017年5 月
- 2017年3 月
- 2017年2 月
- 2017年1 月
- 2016年11 月
- 2016年10 月
- 2016年8 月
- 2016年7 月
- 2016年6 月
- 2016年5 月
- 2016年4 月
- 2016年3 月
- 2016年2 月
- 2016年1 月
- 2015年12 月
- 2015年11 月
- 2015年10 月
- 2015年9 月
- 2015年8 月
- 2015年7 月
- 2015年6 月
- 2015年5 月
- 2015年4 月
- 2015年3 月
- 2015年2 月
- 2015年1 月
- 2014年11 月
- 2014年10 月
- 2014年9 月
- 2014年8 月
- 2014年7 月
- 2014年6 月
- 2014年5 月
- 2014年4 月
- 2014年3 月
- 2014年2 月
- 2014年1 月
- 2013年12 月
- 2013年11 月
- 2013年10 月
- 2013年9 月
- 2013年8 月
- 2013年7 月
- 2013年6 月
- 2013年5 月
- 2013年4 月
- 2013年3 月
- 2013年2 月
- 2013年1 月
- 2012年12 月
- 2012年11 月
- 2012年10 月
- 2012年9 月
- 2012年8 月
- 2012年7 月
- 2012年6 月
- 2012年5 月
- 2012年4 月
- 2012年3 月
- 2012年2 月
- 2012年1 月
- 2011年12 月
- 2011年11 月
- 2011年10 月
- 2011年9 月
- 2011年8 月
- 2011年7 月
- 2011年6 月
- 2011年5 月
- 2010年11 月
- 2010年1 月
- 2009年4 月
- 2009年3 月
- 2009年1 月
- 2008年12 月
- 2008年10 月
- 2007年8 月
- 2006年7 月
- 2006年3 月
- 2005年1 月
- 2004年4 月


