USA/GLOBAL: +1-949-461-9292
EUROPE: +39-011-3052-794
CONTACT US
Sandpaper Roughness Profilometer

Sandpaper: Roughness & Particle Diameter Analysis

Sandpaper: Roughness & Particle Diameter Analysis

Learn more

SANDPAPER

Roughness & Particle Diameter Analysis

Prepared by

FRANK LIU

INTRODUCTION

Sandpaper is a common commercially available product used as an abrasive. The most common use for sandpaper is to remove coatings or to polish a surface with its abrasive properties. These abrasive properties are classified into grits, each related to how smooth or
rough of a surface finish it will give. To achieve desired abrasive properties, manufactures of sandpaper must ensure that the abrasive particles are of a specific size and have little deviation. To quantify the quality of sandpaper, NANOVEA’s 3D Non-Contact Profilometer can be used to obtain the arithmetic mean (Sa) height parameter and average particle diameter of a sample area.

IMPORTANCE OF 3D NON-CONTACT OPTICAL PROFILER FOR SANDPAPER

When using sandpaper, interaction between abrasive particles and the surface being sanded must be uniform to obtain consistent surface finishes. To quantify this, the surface of the sandpaper can be observed with NANOVEA’s 3D Non-Contact Optical Profiler to see deviations in the particle sizes, heights, and spacing.

MEASUREMENT OBJECTIVE

In this study, five different sandpaper grits (120,
180, 320, 800, and 2000) are scanned with the
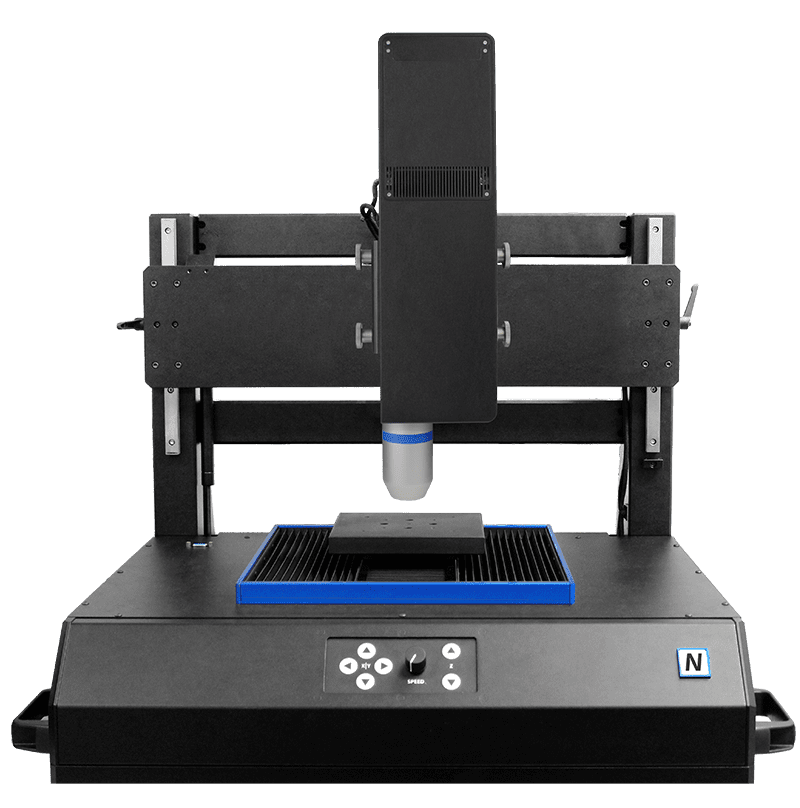
NANOVEA ST400 3D Non-Contact Optical Profiler.
The Sa is extracted from the scan and the particle
size is calculated by conducting a Motifs analysis to
find their equivalent diameter

NANOVEA

ST400

RESULTS & DISCUSSION

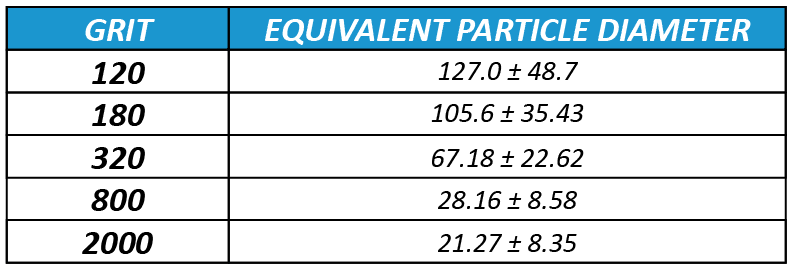
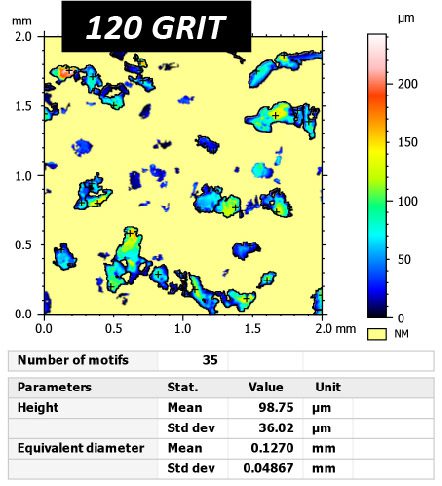
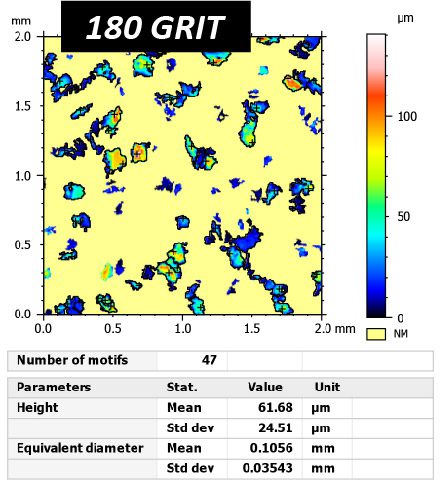
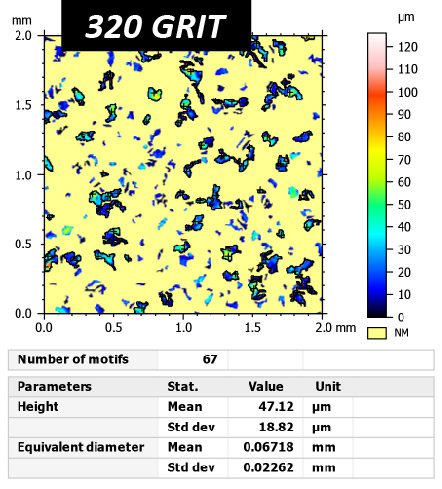
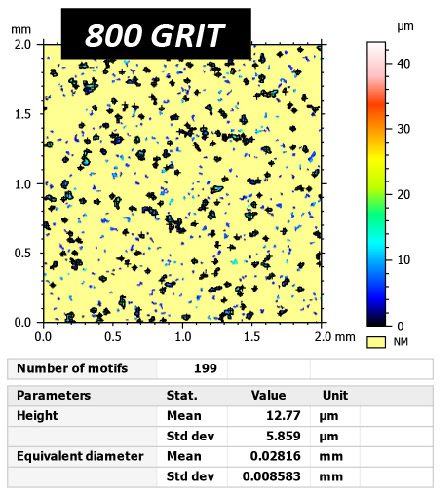
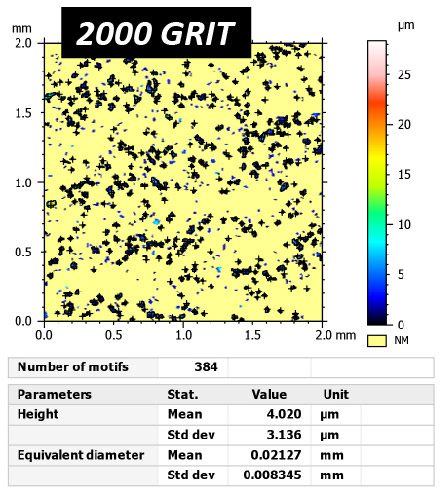
The sandpaper decreases in surface roughness (Sa) and particle size as the grit increases, as expected. The Sa ranged from 42.37 μm to 3.639 μm. The particle size ranges from 127 ± 48.7 to 21.27 ± 8.35. Larger particles and high height variations create stronger abrasive action on surfaces as opposed to smaller particles with low height variation.
Please note all definitions of the given height parameters are listed on page.A.1.

TABLE 1: Comparison between sandpaper grits and height parameters.

TABLE 2: Comparison between sandpaper grits and particle diameter.

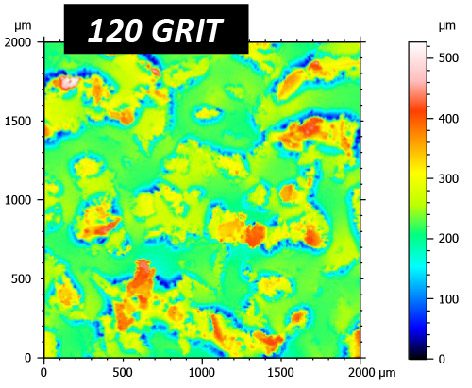
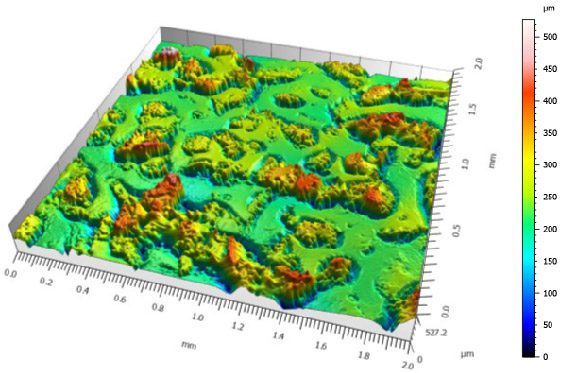
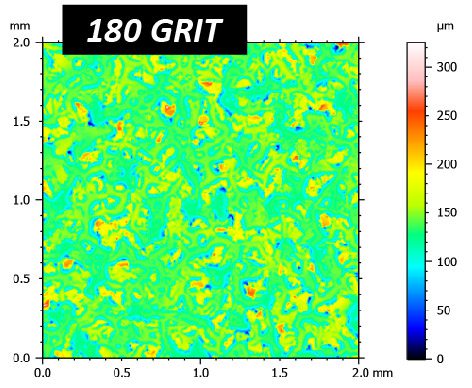
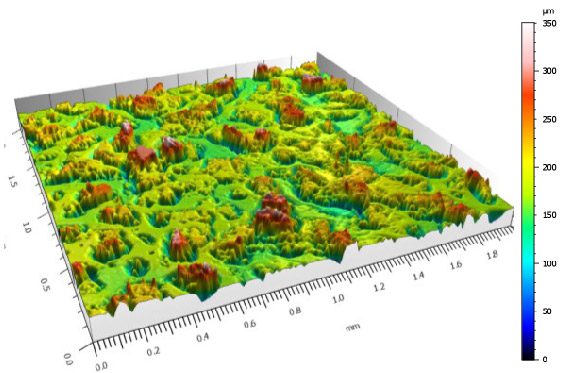
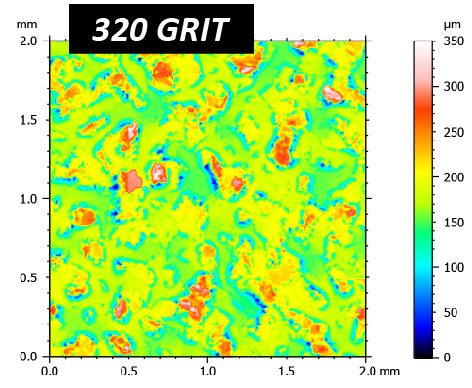
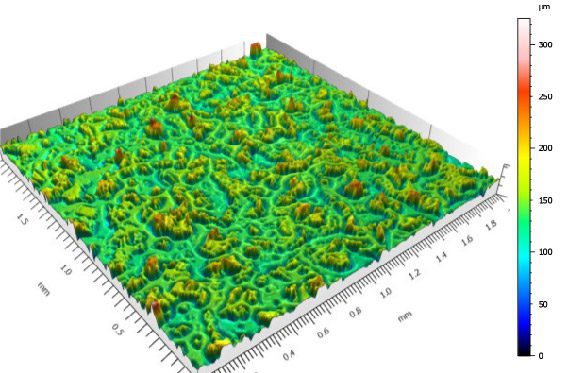
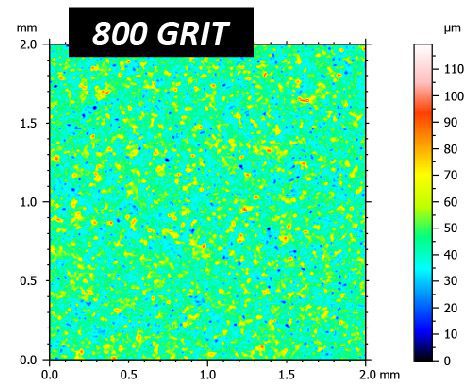
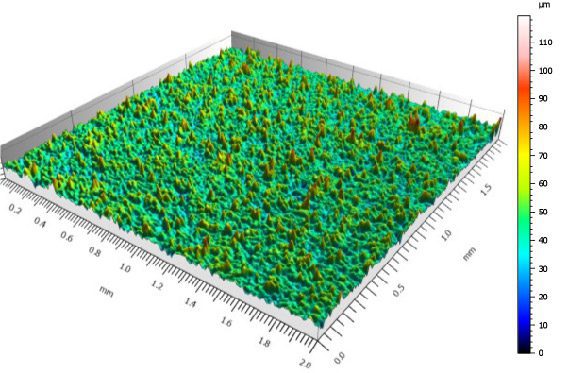
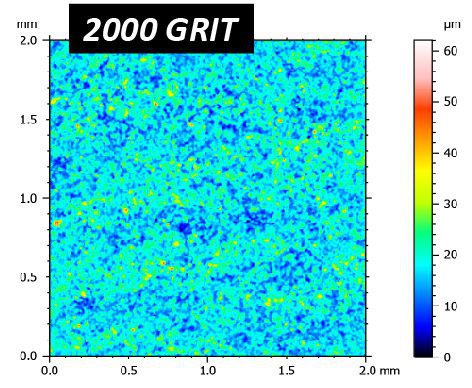
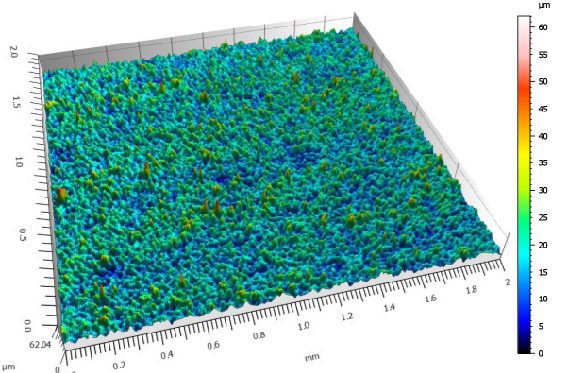
2D & 3D VIEW OF SANDPAPER 

Below are the false-color and 3D view for the sandpaper samples.
A gaussian filter of 0.8 mm was used to remove the form or waviness.

MOTIF ANALYSIS

To accurately find the particles at the surface, the height scale threshold was redefined to only show the upper layer of the sandpaper. A motifs analysis was then conducted to detect the peaks.

CONCLUSION

NANOVEA’s 3D Non-Contact Optical Profiler was used to inspect the surface properties of various sandpaper grits due to its ability to scan surfaces with micro and nano features with precision.

Surface height parameters and the equivalent particle diameters were obtained from each of the sandpaper samples using advanced software to analyze the 3D scans. It was observed that as the grit size increased, the surface roughness (Sa) and particle size decreased as expected.

NOW, LET'S TALK ABOUT YOUR APPLICATION

Comment